


Watching The Market's Rise
H2 2019 Begins Strong, Weekly Update & Notes

The second half of 2019 is a U.S. market offering a return to highs thought indefinitely lost in Q3/Q4 2018. We begin with an updated view of the broader indices and charts.


The top down view is an impressive lesson in how this market, from a long term point of view, can change direction very quickly. I do not mean day trader or HFT quickly, I mean that inside a single quarter, we went from a closed list in mid-November 2018, and a lot of sitting on hands, to a brand new ideas list by March 2019 filled with leader that have produced double digit returns that were coming from a variety of sectors.
Let’s survey the Top 20 LONGS and Top 20 SELLS and then move quickly to the stopped out charts. First of course, I like to post a Top Down summary sheet for this week and from pre-July 4th holiday. The short version: Long and Strong is the signal.
This is the latest Top Down summary. The longs continue to chock up gains, and the losing LONG ideas have smaller losses in aggregate, going from 10K to 5K over the last 2 weeks. It’s not just the winners I look at, but also the laggards of ideas that have not yet hit their stops. The SELL ideas haven’t budged much in terms of notional gains which tells me they are truly weak ideas that long-focused traders should be careful of.

Here is the Top Down summary from 2 weeks ago, from before the July 4 holiday.

These little summary charts are my way of taking Mr. Market’s temperature via the lens of my trend trading ideas universe. For your notes, it reads as “longs get strong”.
Let’s move on the Top 20 LONGS and then the same for the SELLS plus charts. What I hope you will find useful are my suggested updated stop loss exit weekly prices for these LONG ideas. For all the leadership at this point the minimum stop loss price is the entry price (which is usually the closing price of the week the idea was added).

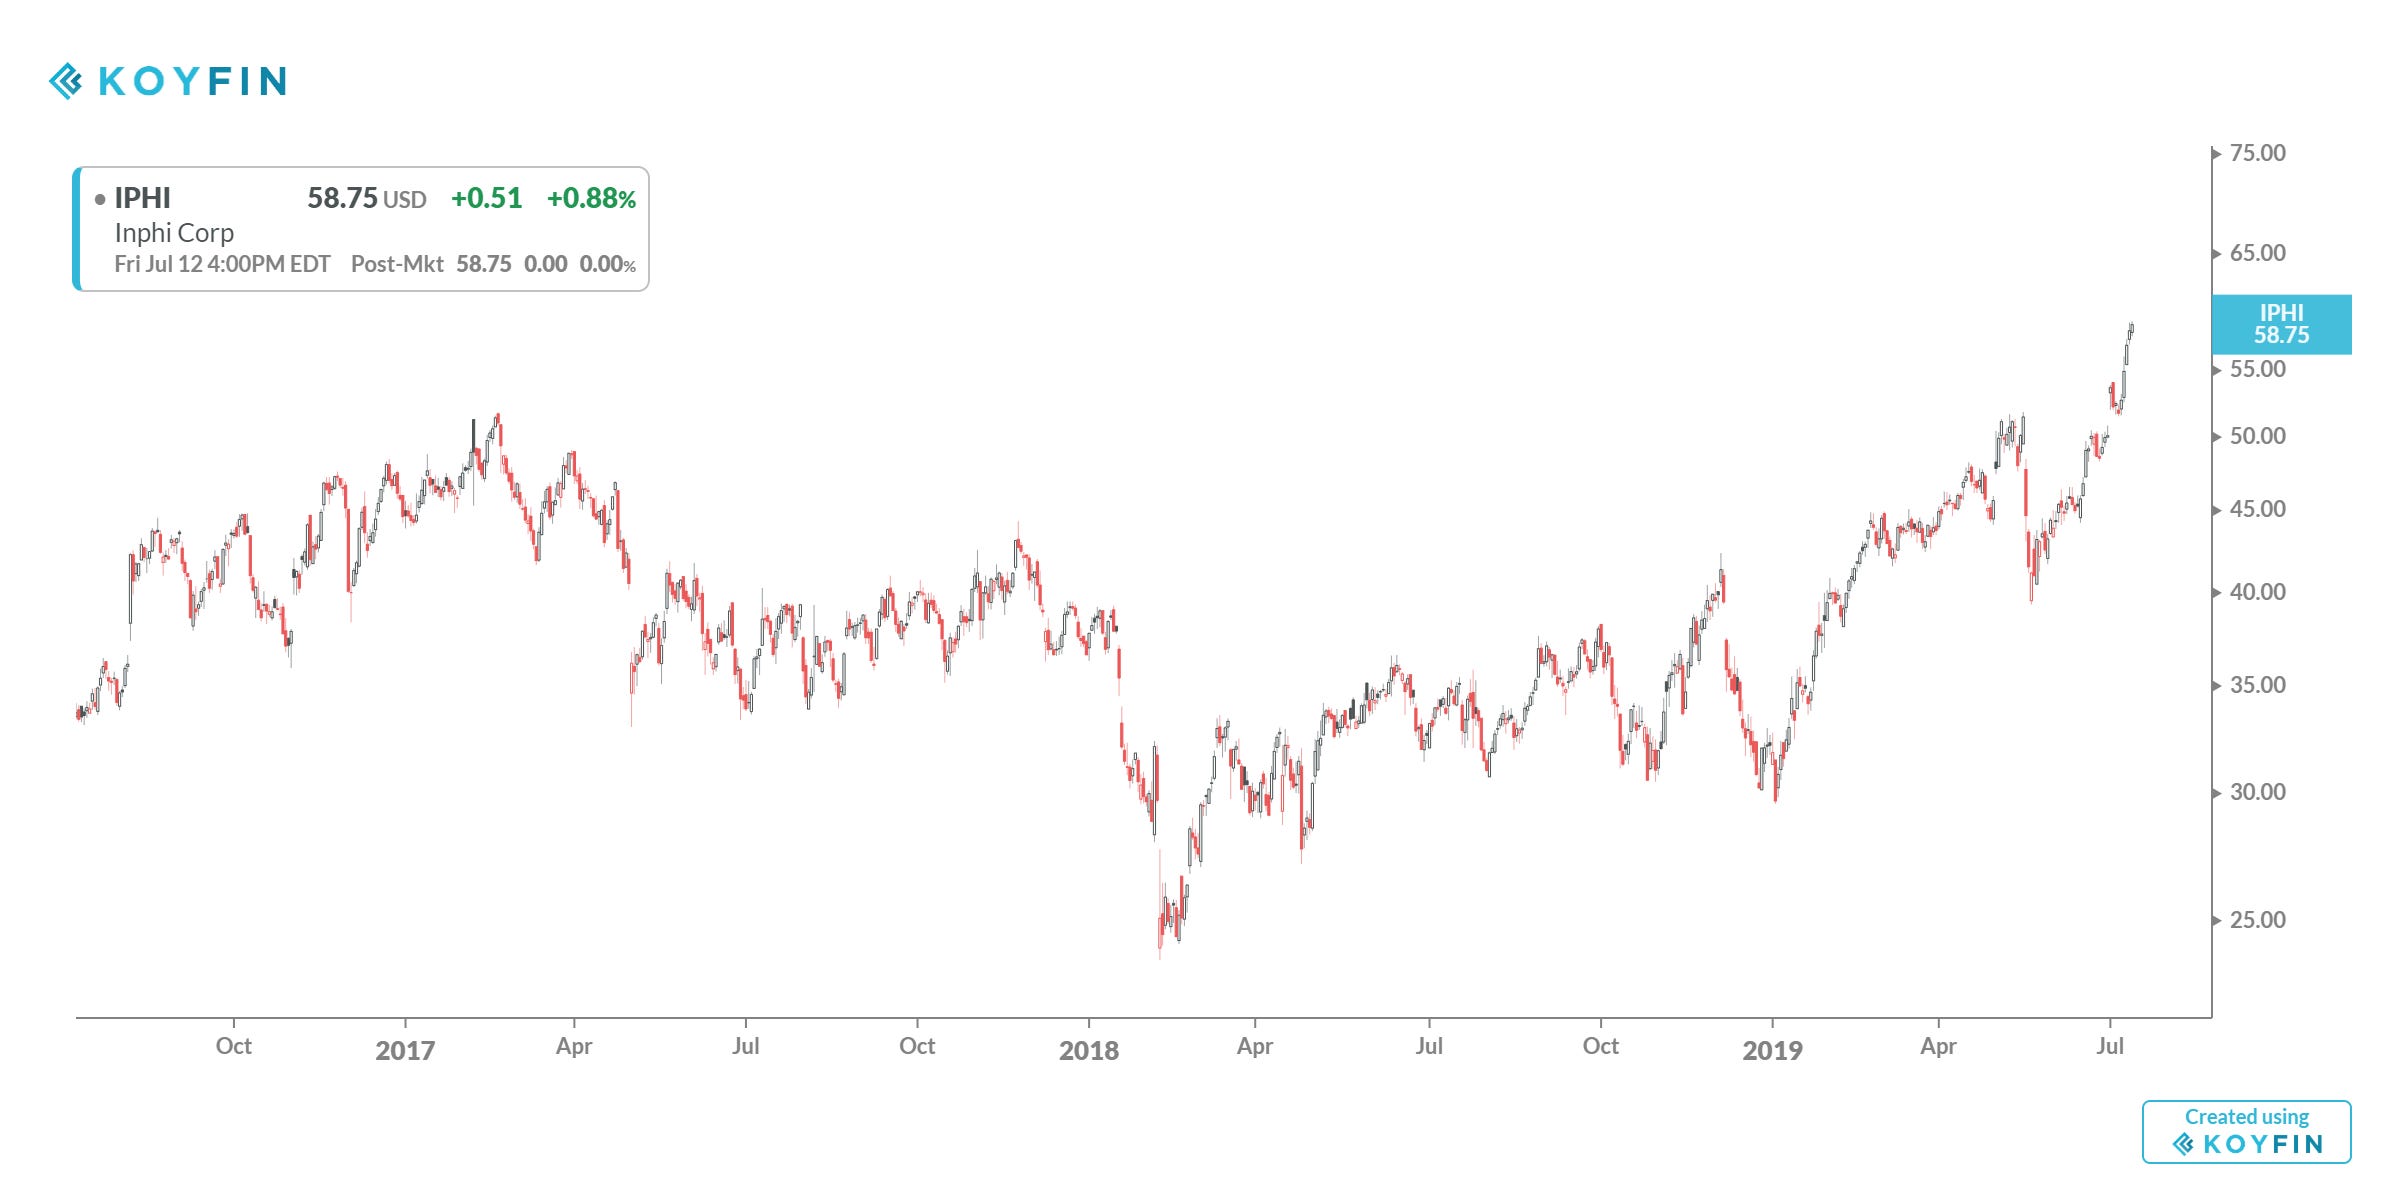
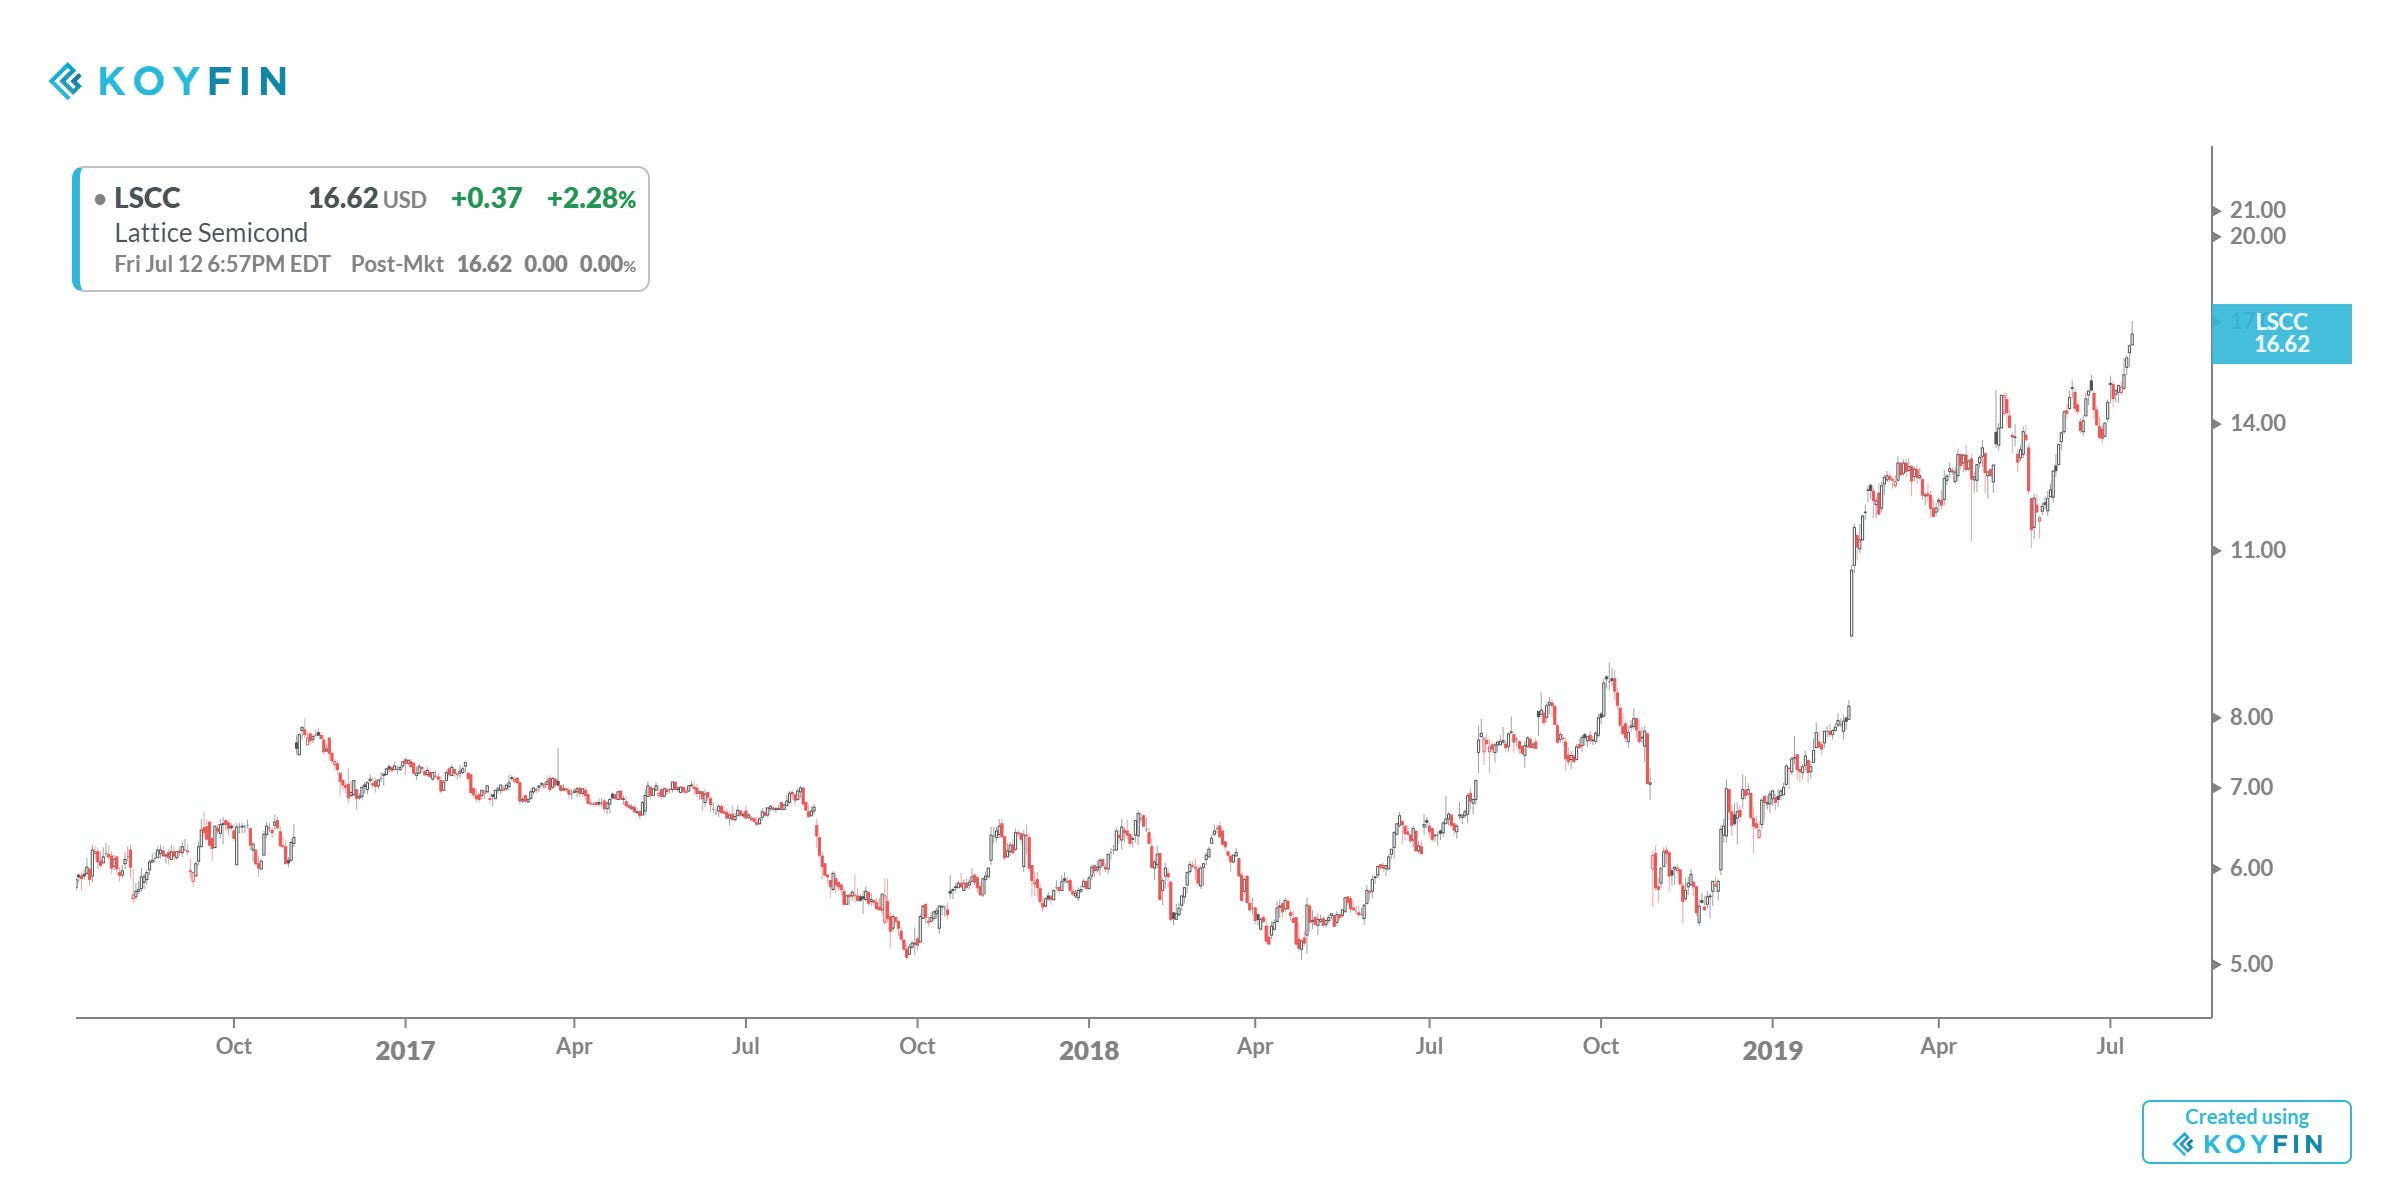
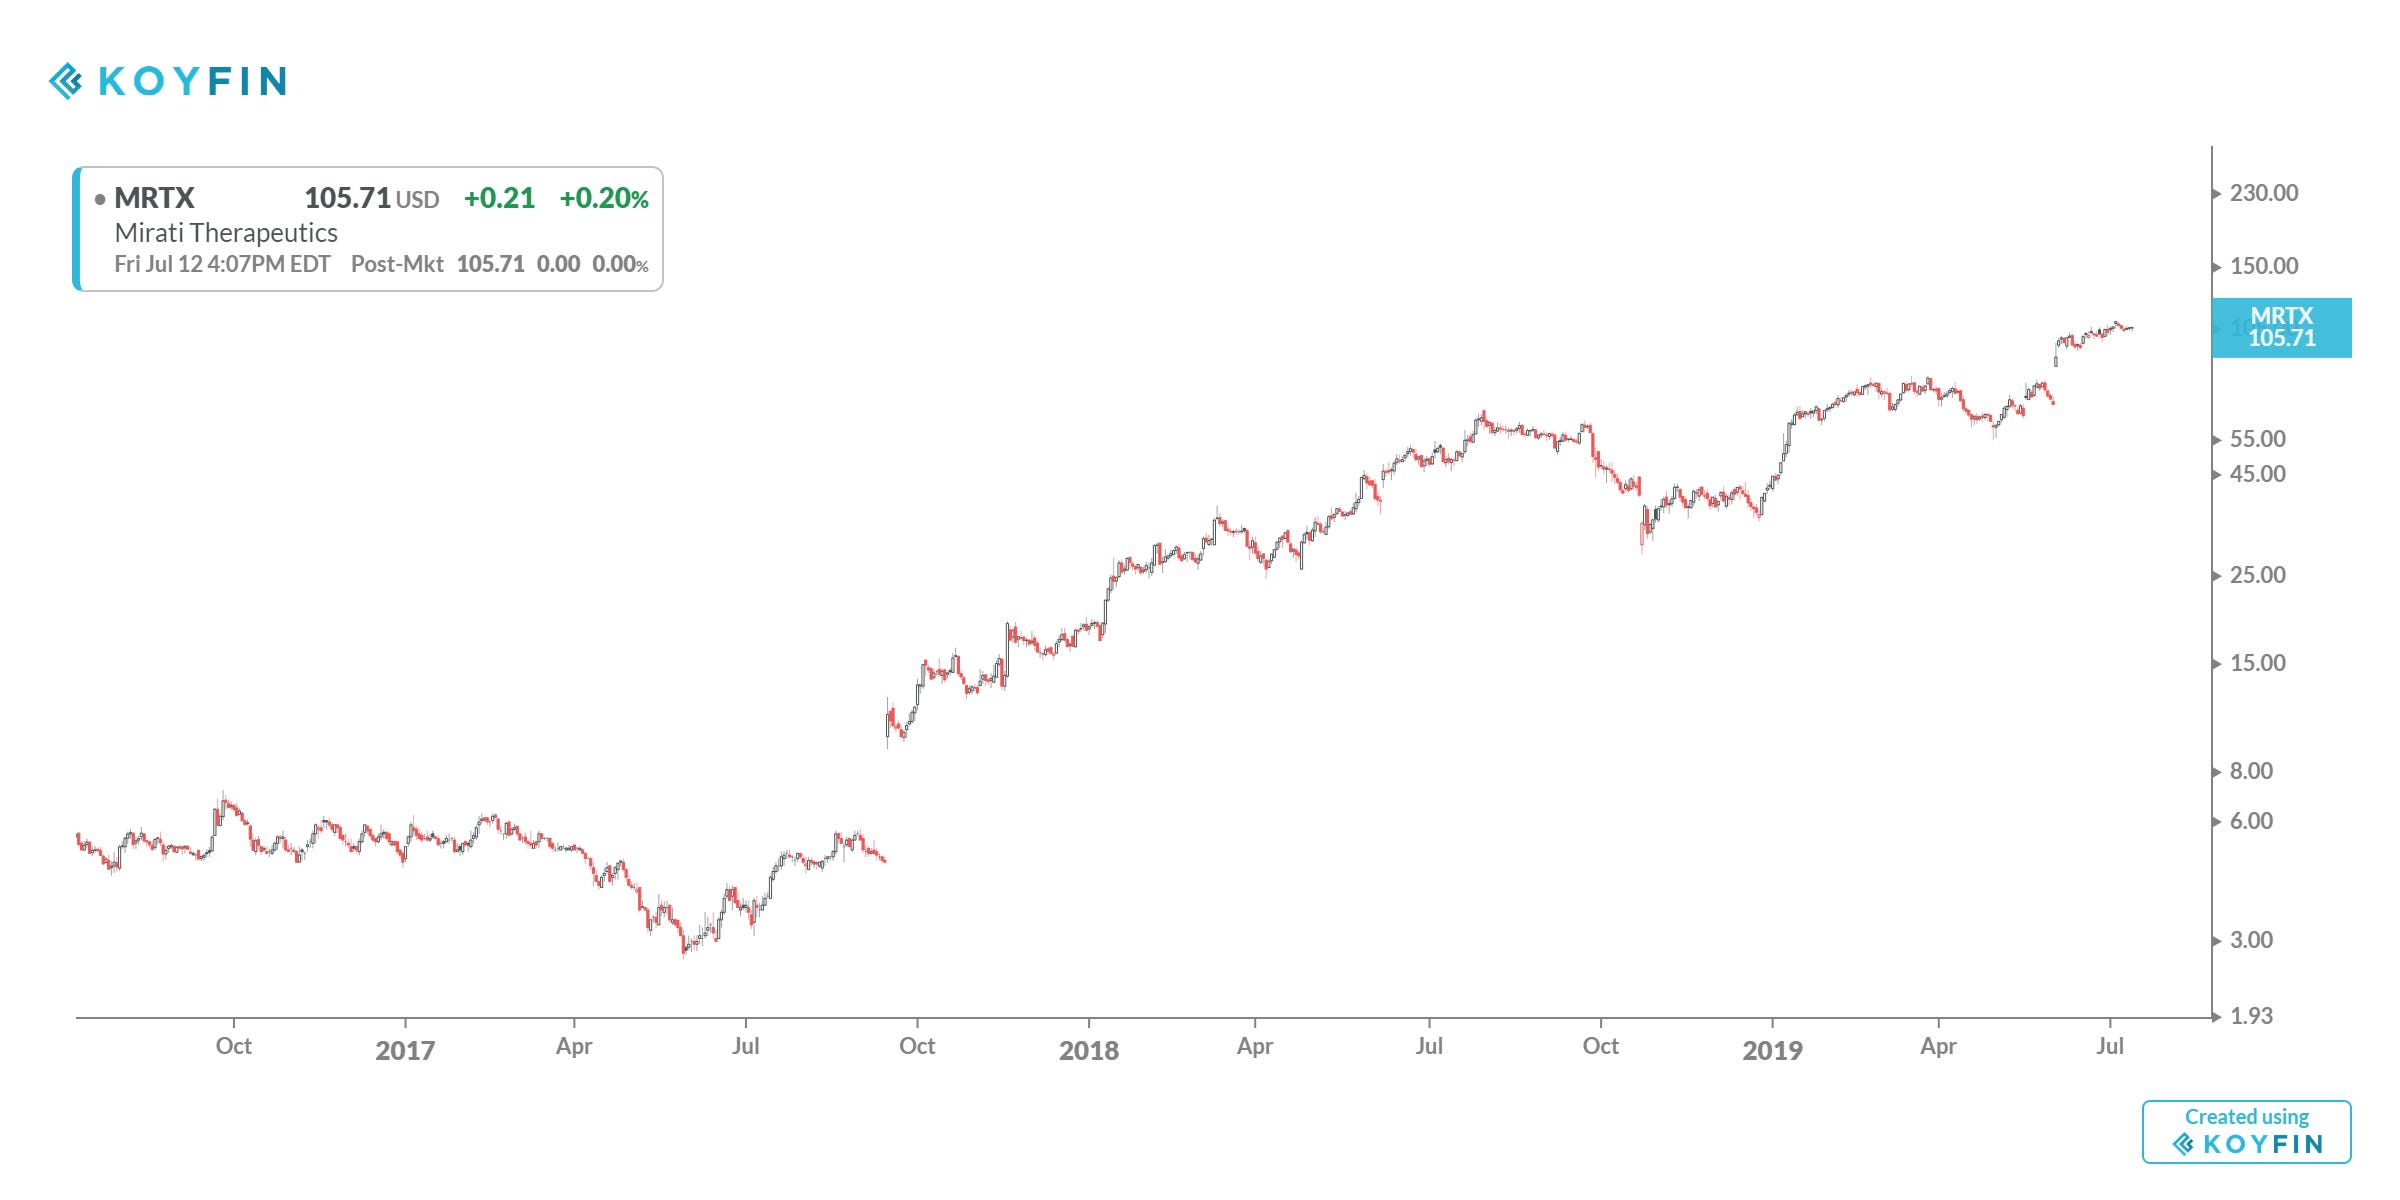
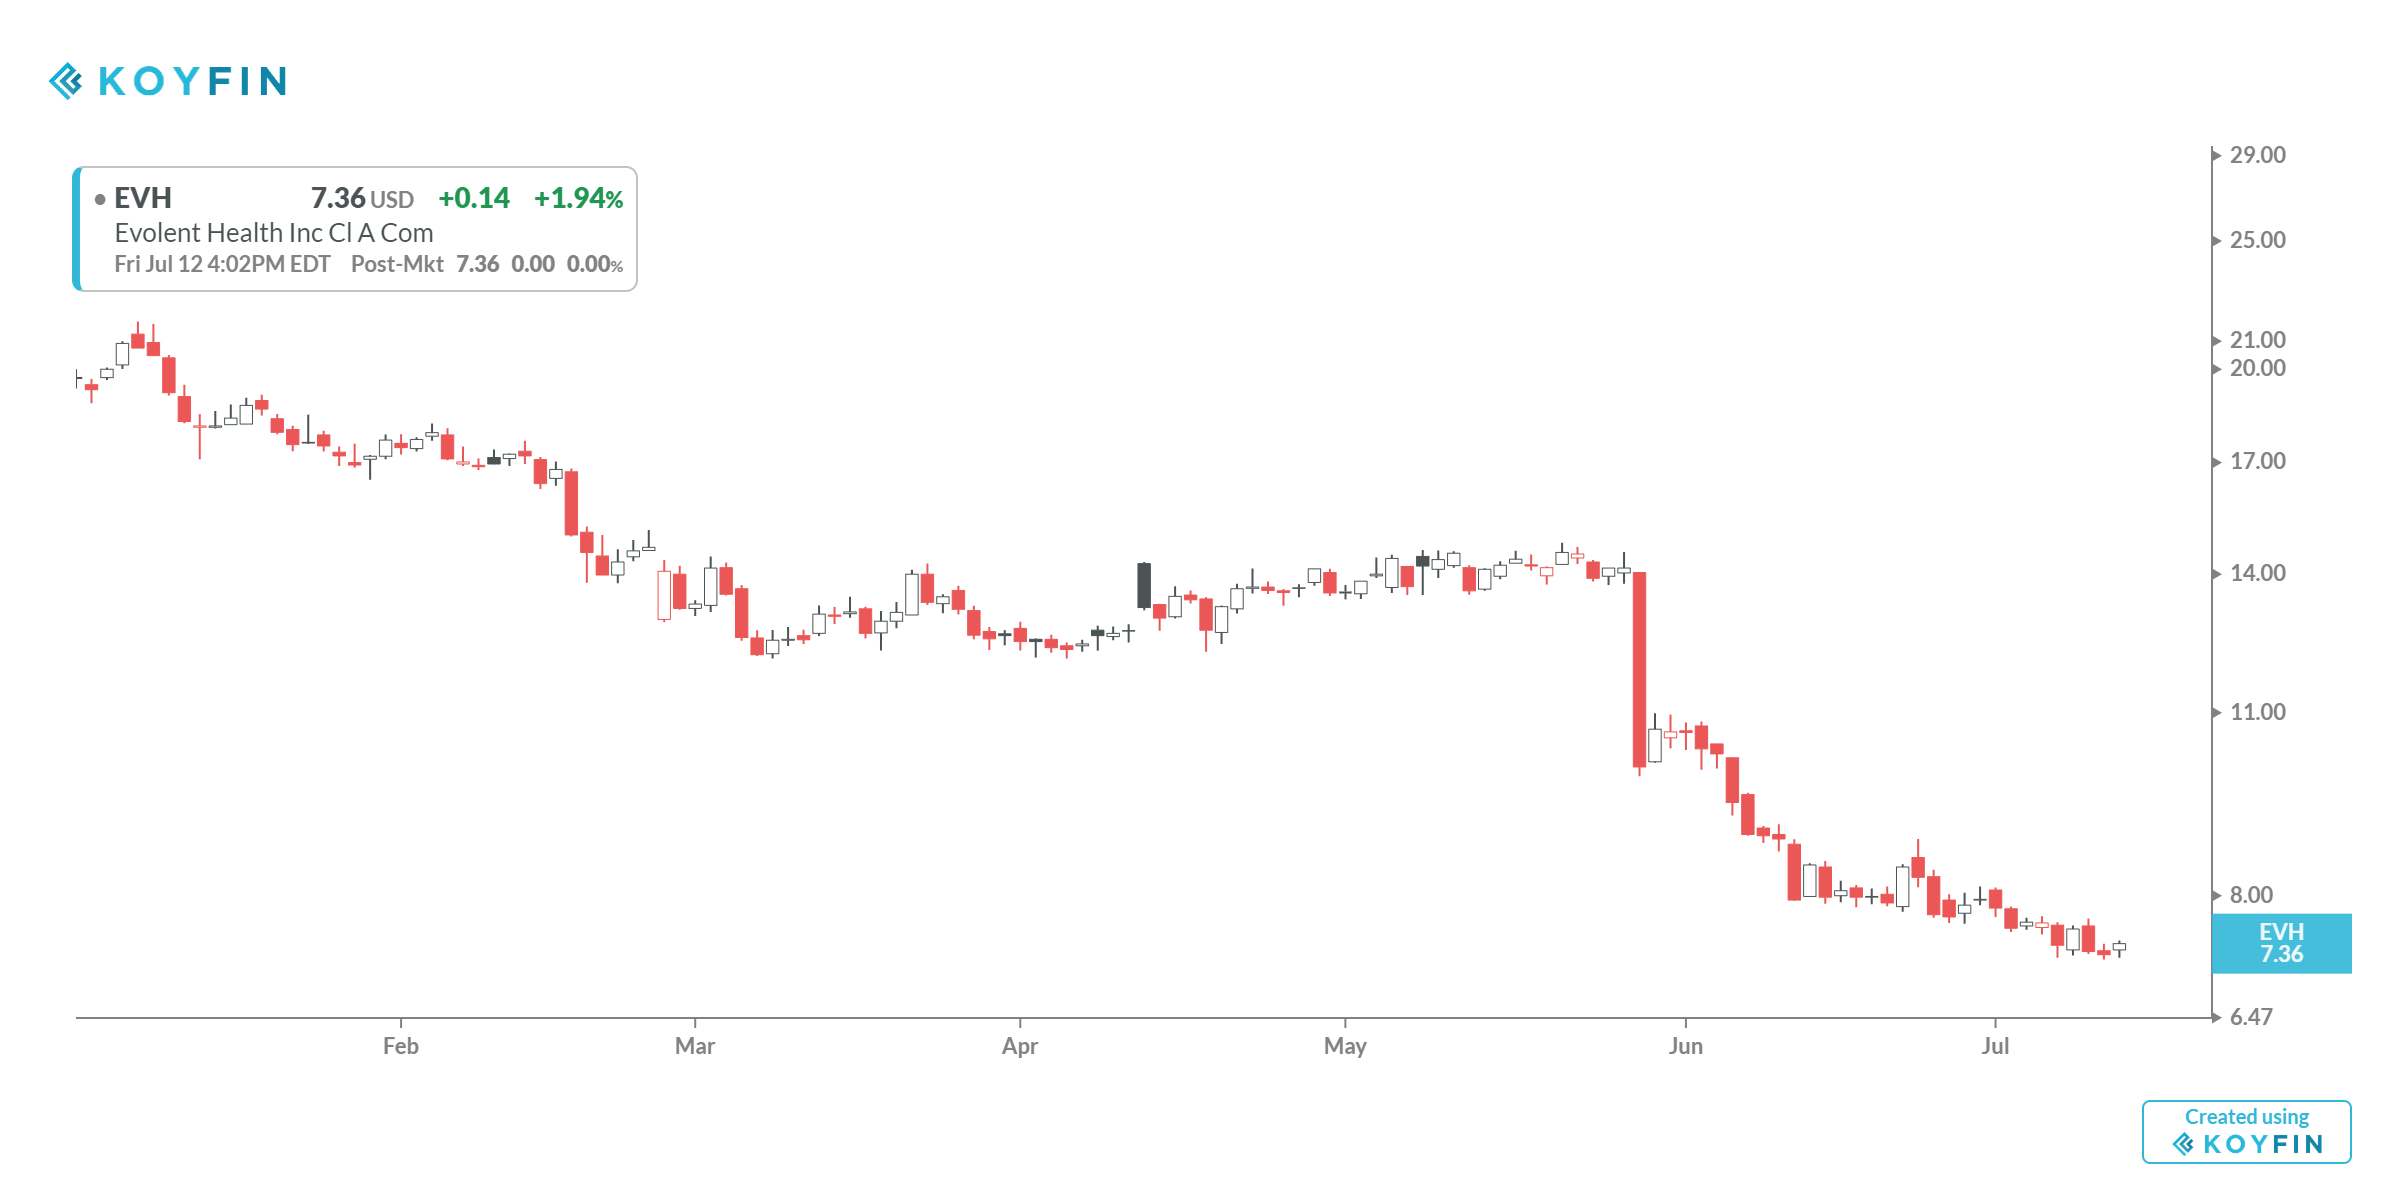
For those of you who want to see all the charts from this Top 20 LONG list here’s a Koyfin Charts dashboard link you can use. I would like to share a few charts from this list which have run the hottest over the past 30 days for your review.


And now for the Top 20 SELLS. This is a cautionary avoid list or even a bargain hunters list for those of you adept at finding unimpaired values with a catalyst.
Again, here is another Koyfin Charts dashboard Top 20 SELLS list for your notes and just a few related charts from this list for your notes and review. Weak gets weaker.


Let’s move on to ideas that may become Top 20 leaders eventually - no promises.
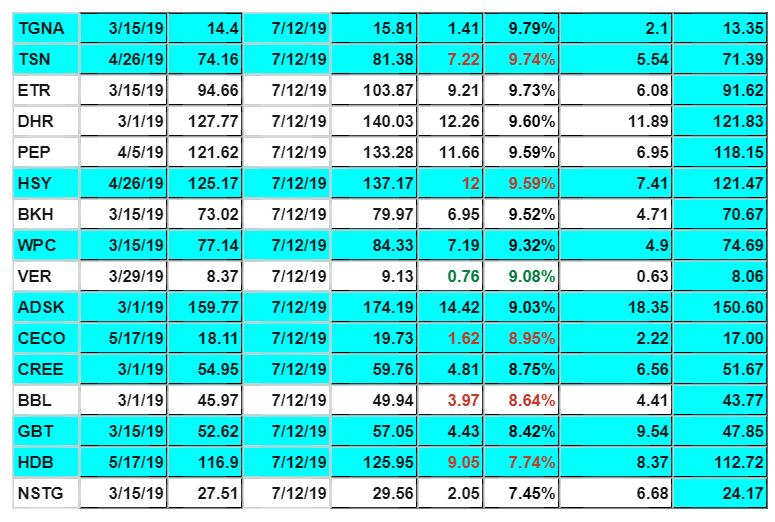
Here is a nice free list of LONG ideas which could continue to run and move higher.
You will see the ticker, the week it was added, the weekly close at that time, the current price, the gain in dollar and percentage terms, and most critical of all, a suggested “risk per share” figure and the current stop loss exit price. That is the biggest nugget of “secret”, “holy grail”, “magic recipe” info you can get that you should focus on: how much to risk on an idea. I can’t guaranteed success but I can suggest how you might be able to limit your downside in case a trend fails.
(example, in the below chart, you will see a figure of “2.1” for ticker TGNA, that’s the “Risk per share” that could be used for figuring out where to close out a long if it’s wrong and just how much to trade. Imagine you have about $100 to risk: divide $100 by 2.1 and that gives you less than 50 shares as your trading size. Imagine you entered at $X so your stop loss exit price is equal to “$X minus 2.1”.
It may sounds dumb or simple but really most folks are complicating their lives and assuming stress when they have a day job, a business, and/or a larger portfolio of assets and savings to worry about. If you respond with “I know ALL about this, etc., etc.” that’s great - hopefully you also know about having discipline and detachment when it comes to risk taking. Nobody cares what’s in your portfolio, not really, when they ask, they’re really asking to help themselves deal with an internal concern about their own decisions, for confirmation bias, or to reduce cognitive dissonance. Pay them no mind and focus on your process.
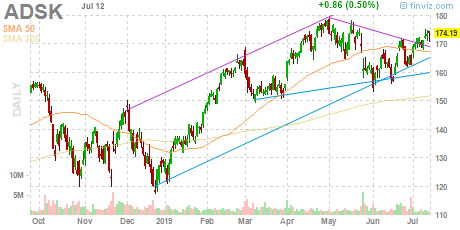
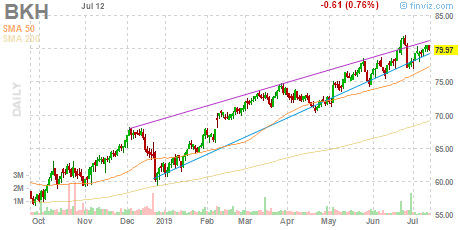
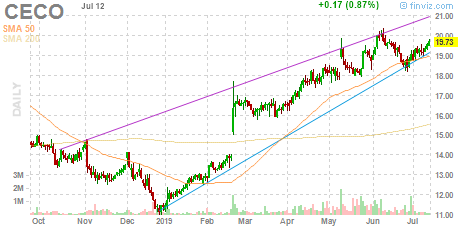
Anyway, here is a summary chart of potential long ideas which haven’t run too far yet, plus charts via a simple Finviz screen to provide a quick and dirty overview of them.


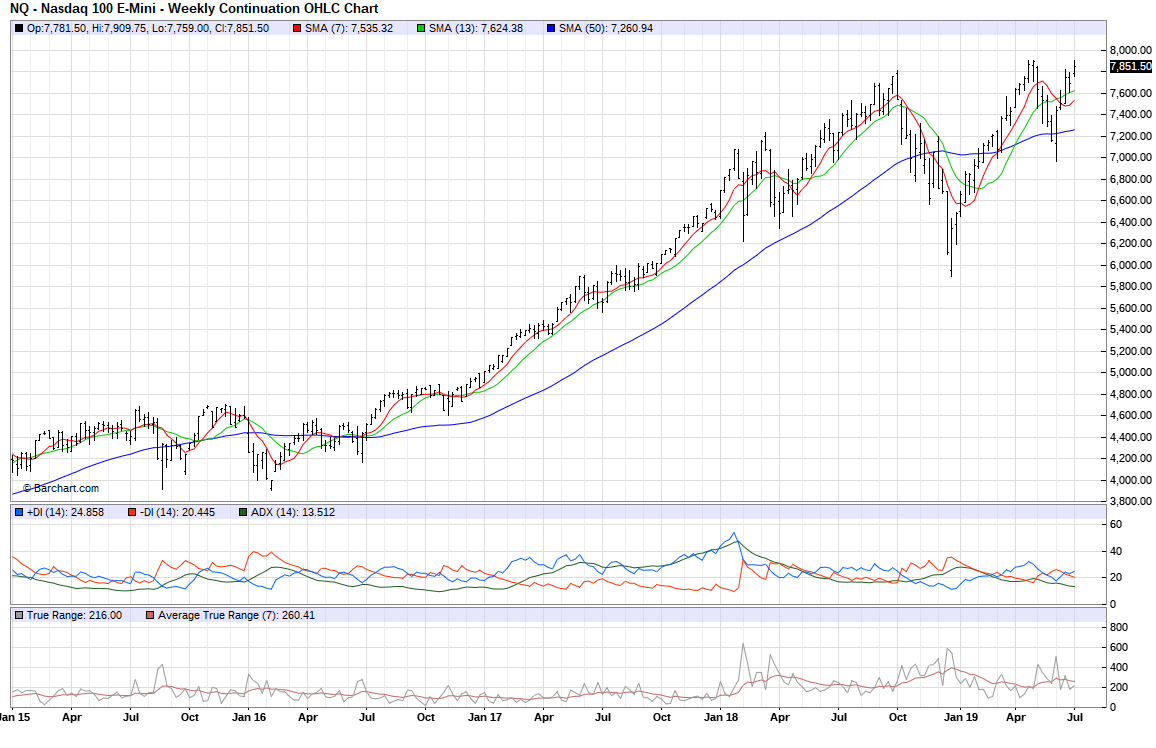
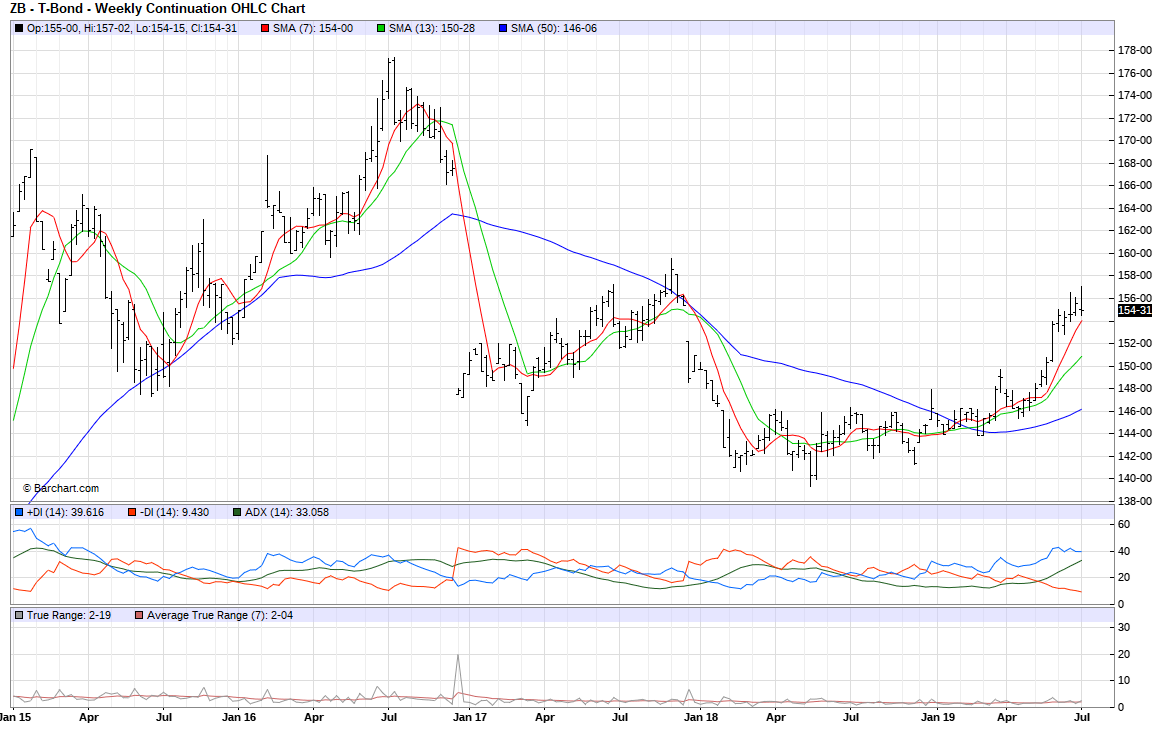
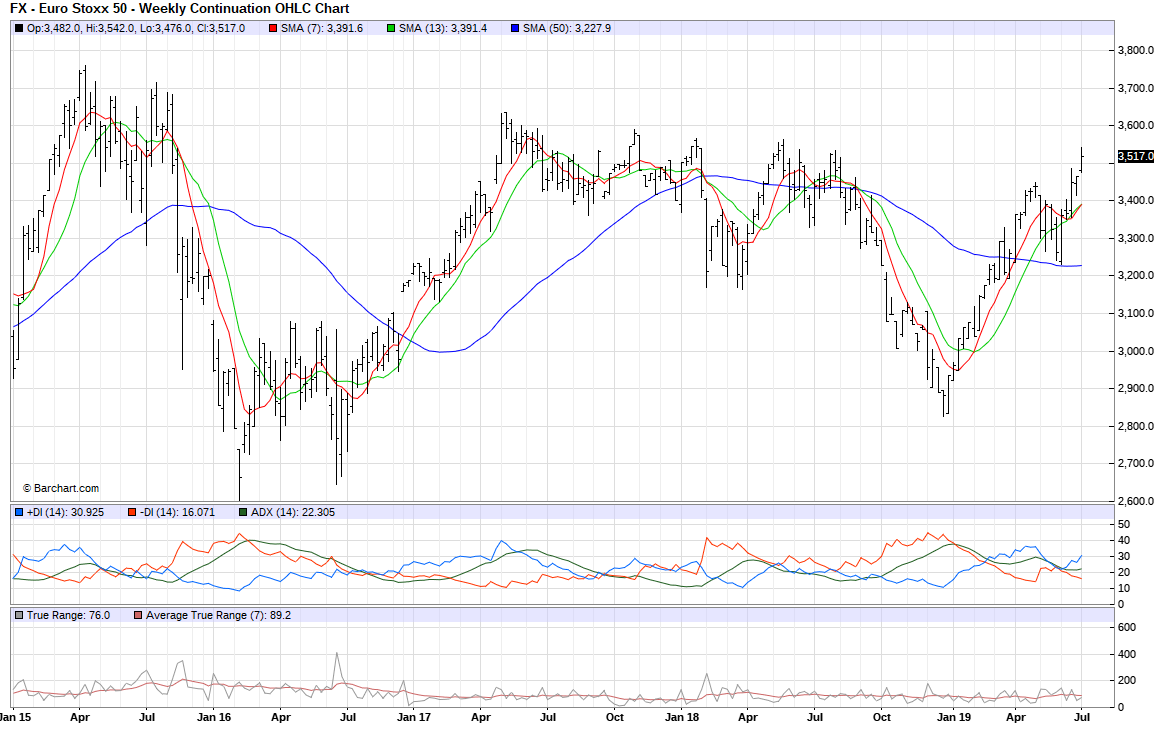
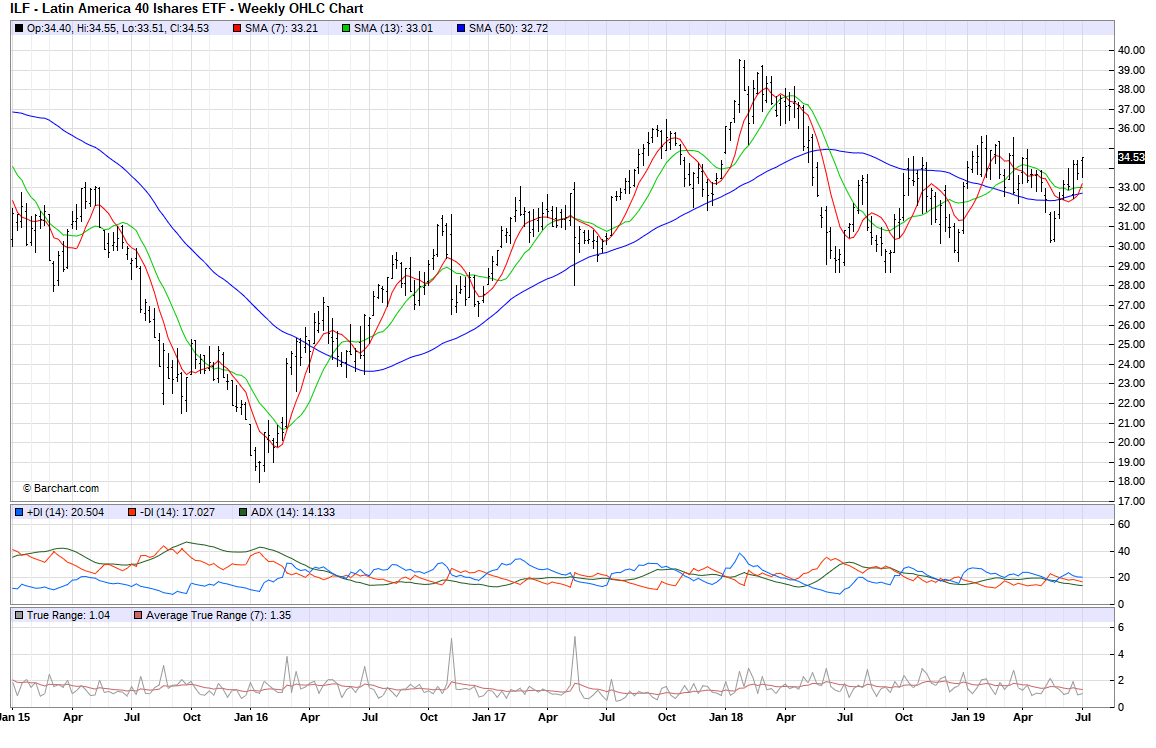
Let’s close with just a few top down futures charts to get a broader view of markets. This is just a sample view of the world’s various markets to give us a sense of trends.


S&P 500 Consumer Discretionary is on my mind. A random thought.

Louis Vuitton. Shopping. Luxe. Fashion. A Berkshire Hathaway of Luxury. This was part of a theme I liked in December 2018 when I shut down the trend following list in November 2018, when it was dominated by short ideas and inverse ETFs.
“Lumpy Luxe” doing well so far. Ferrari (RACE) is another one, and on the domestic U.S. not as deep pockets end Amex and Disney have done well too. Animal spirits on the long thin tail of global luxury consumers continues to run up and to the right. Ultra discretionary.


