


Trend Update: Bruised But Not Beaten
Trend Trading List Update, Mid-Q2 2019

Bruised but not yet beaten has been this past week’s market action and sentiment.
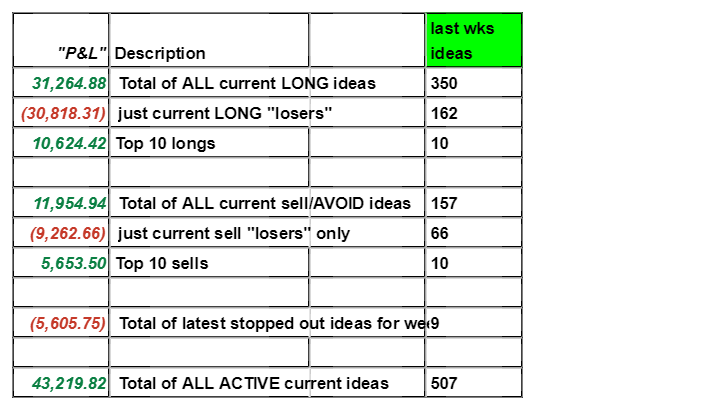
Let’s review the top down summaries to get a sense of the master ideas universe and then work our way through the Top 20 lists, Worst 20 lists, a list of stopped out ideas and then charts pulled from the ideas universe.
In short the list is still hovering around 500+ ideas, there were a few long ideas which hit their suggested initial stop loss exit prices, and notional gains in the SELL/ avoid / short side did better this week but notional LONG profits were still in the lead. None of this is a surprise to regular observers of this past week’s market action.

The prior week’s top down summary is shared to give us a reference point.
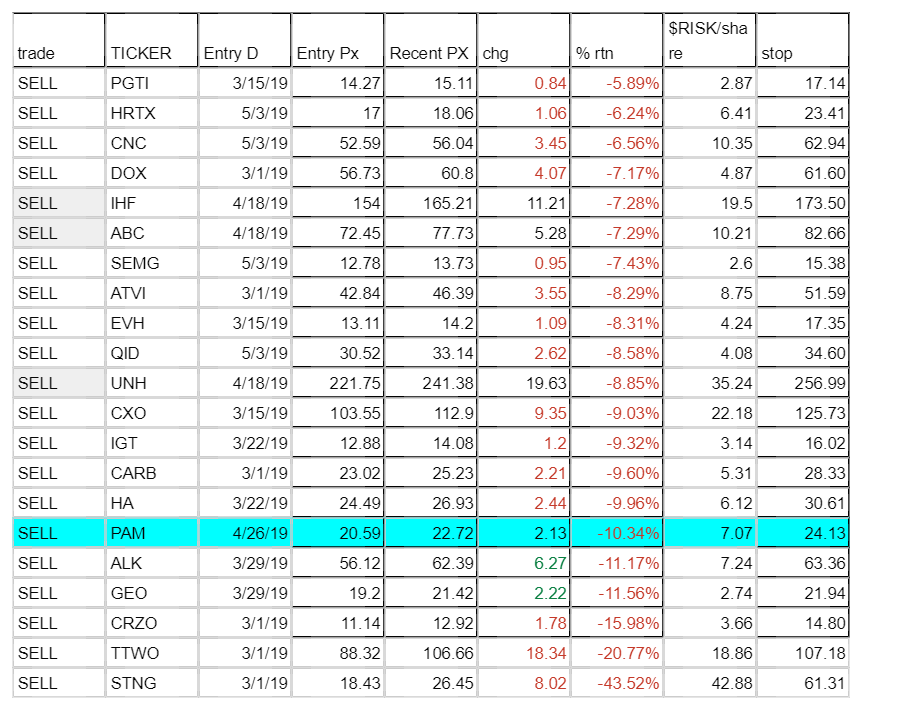
And now for the various lists, beginning with the Top 20 LONGS. NOTE: provided for your convenience, for those who need a stop loss exit price or an estimated risk per share amount, each table has a “$RISK/share” and “stop” column.
(How to understand the RISK and STOP columns in the summary sheets: these are estimated figures. Say “$RISK/share” is $1.00 - that means I would tolerate about a $1.00 of weekly price change for stock XYZ. If your system gives you an ability to risk losing $100 then you can trade ($100/$1/share) or 100 shares. The “stop” column is a separate estimate based on subtracting the “$RISK/share” from the weekly closing price during the first week an idea is added to a list. Say idea XYZ was added to the list a few weeks ago and the closing price that first week was $50/share. If the “$RISK/share” was $1.00, then the initial suggested stop loss exit price is $50 - $1= $49.)
(Please pardon the above oversimplified explanation of those columns’ purposes, it was meant to address some questions from some folks about systems, rules, etc. I assume that most of you don’t need or care about such details but I wanted to give an answer.)

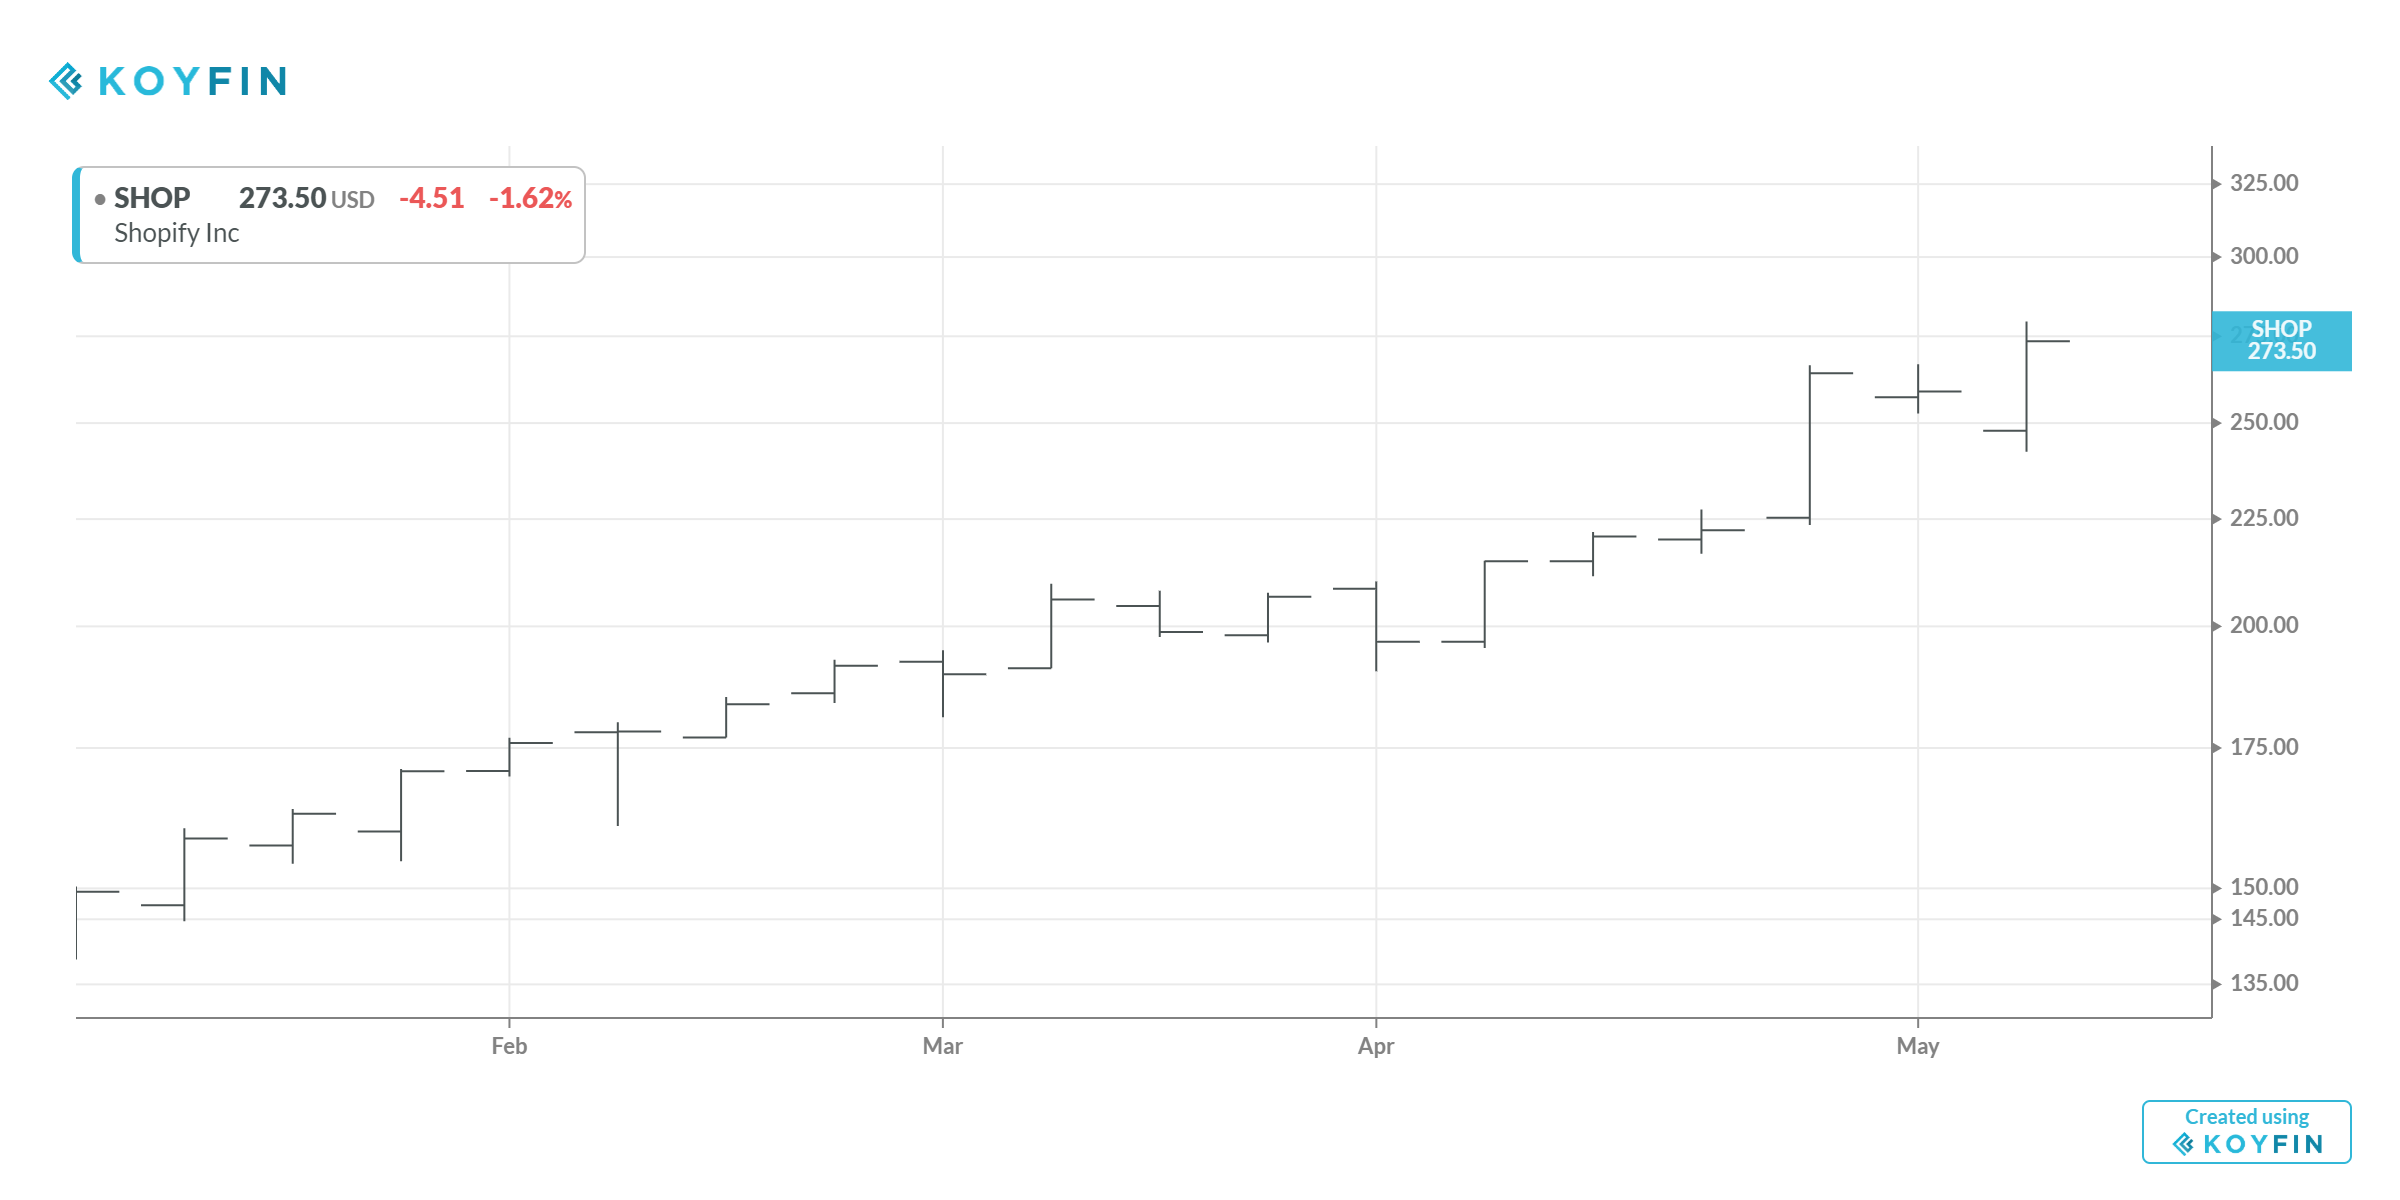
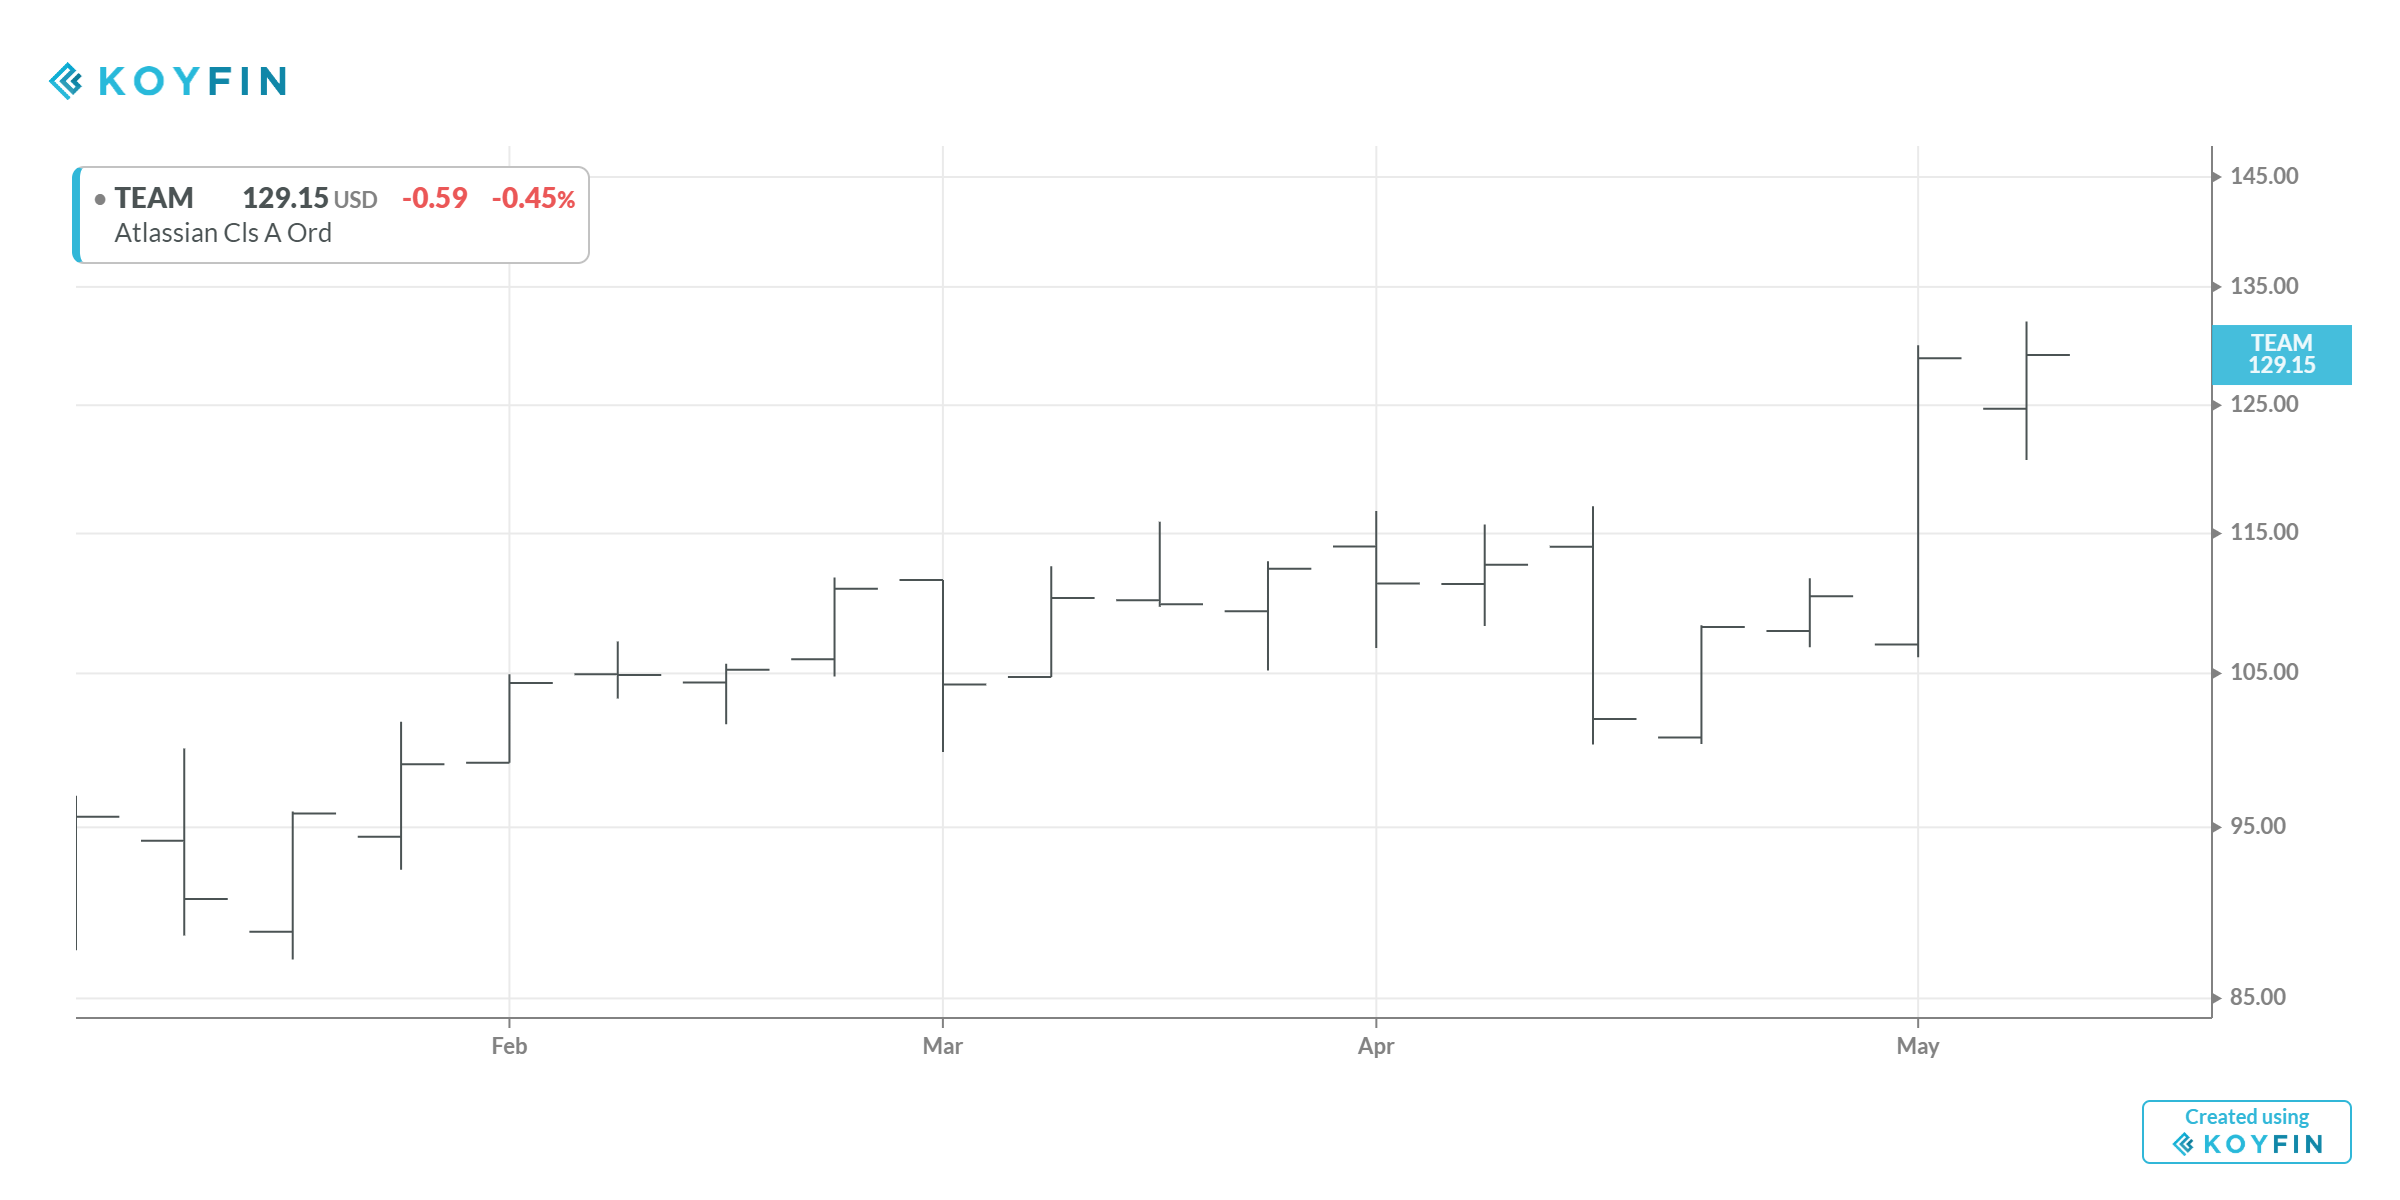
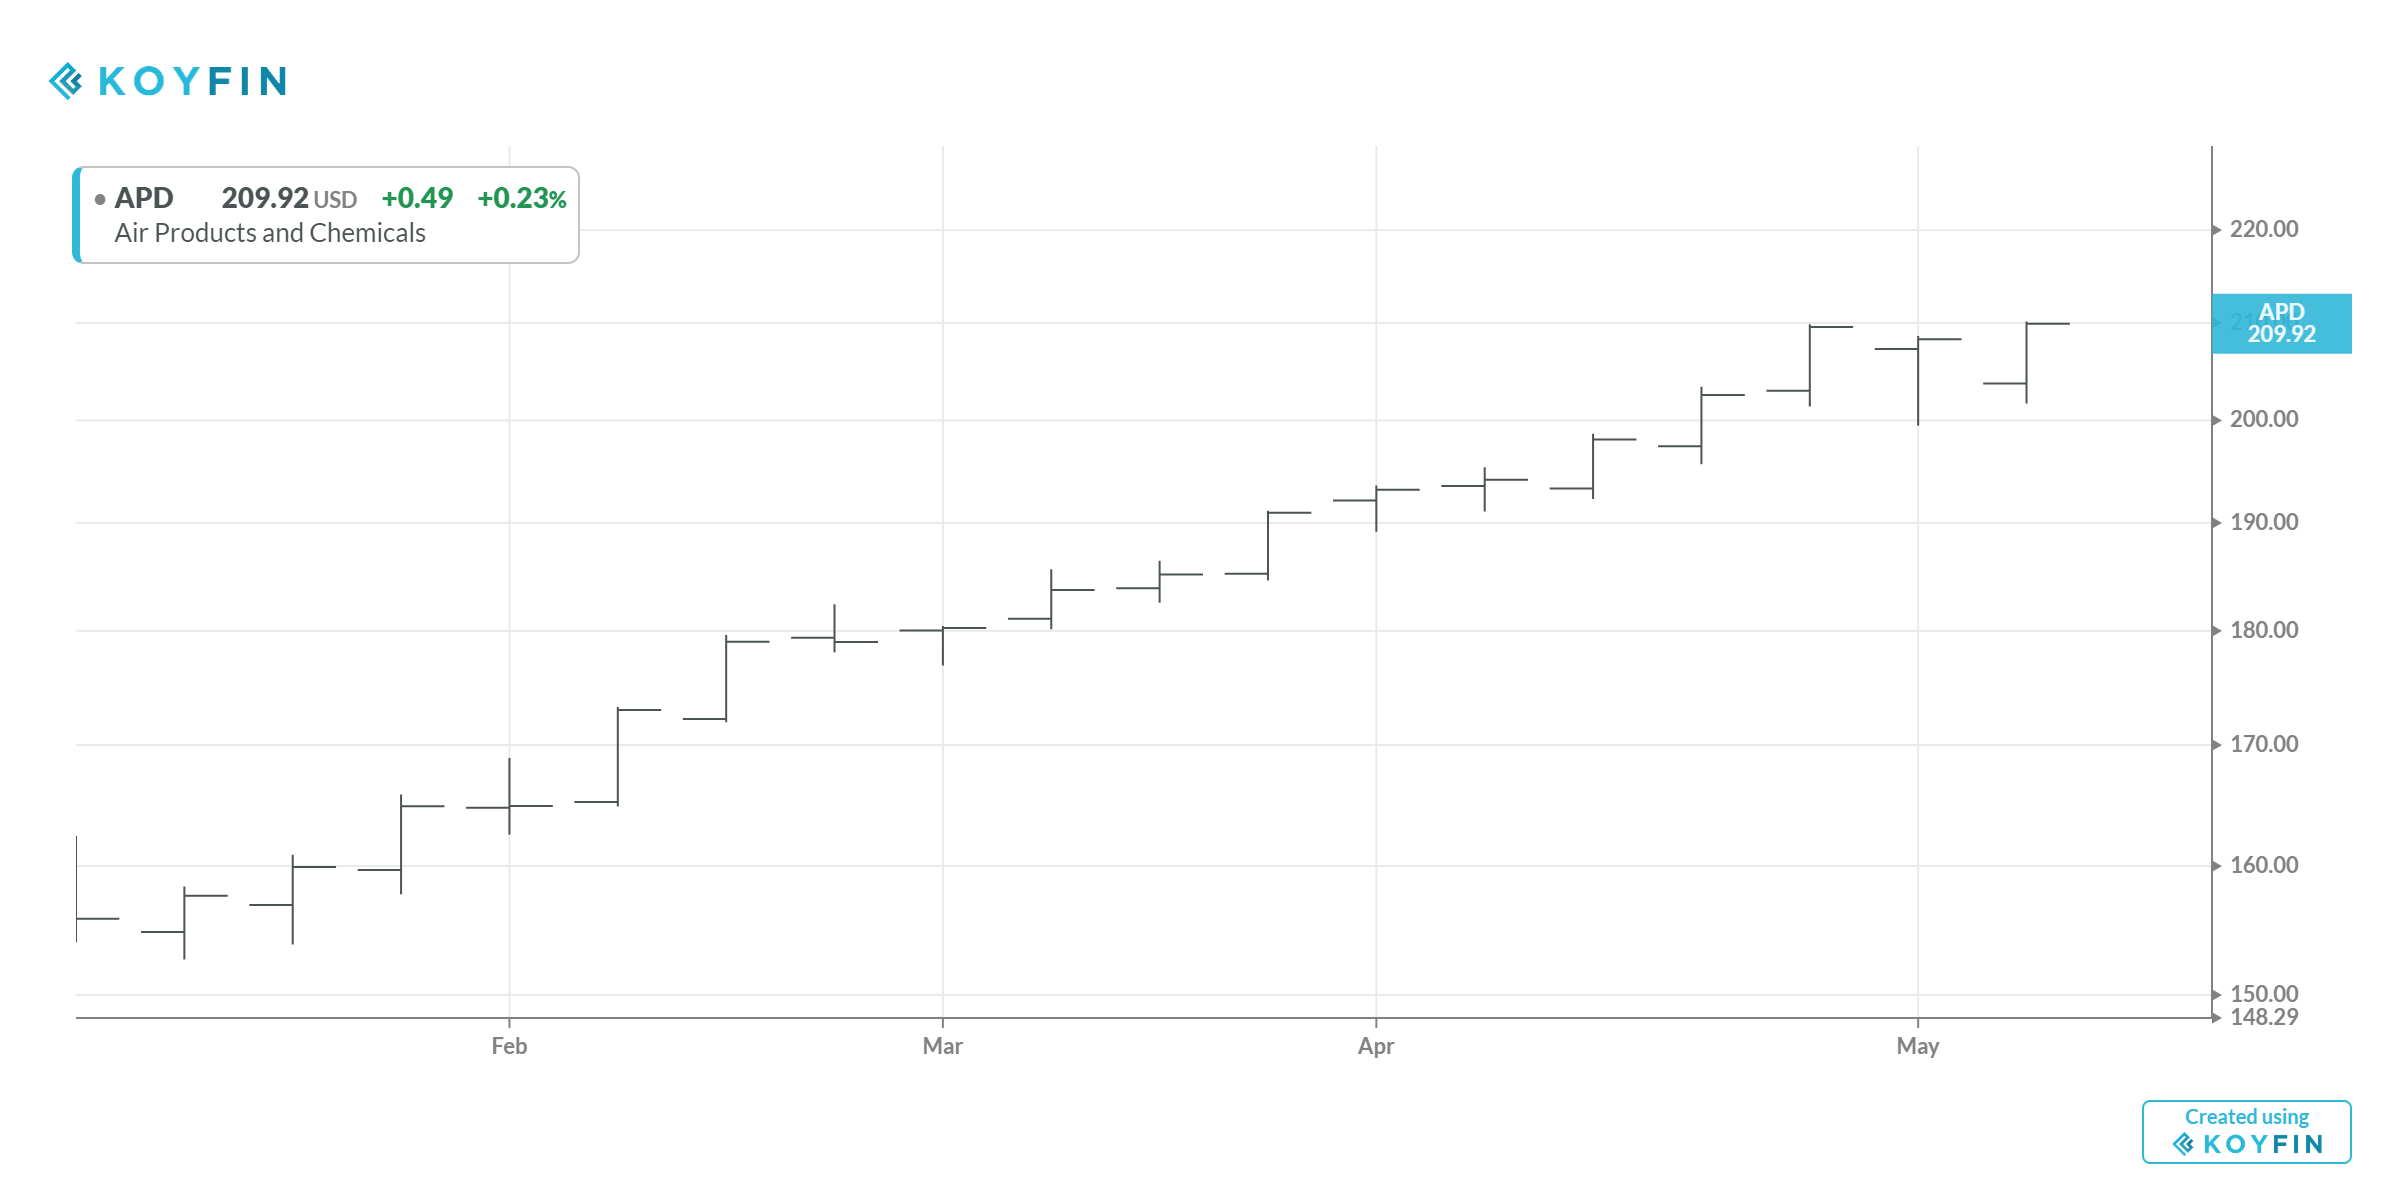
A few charts from the Top 20 LONGS as of this week. So placid with weekly price.


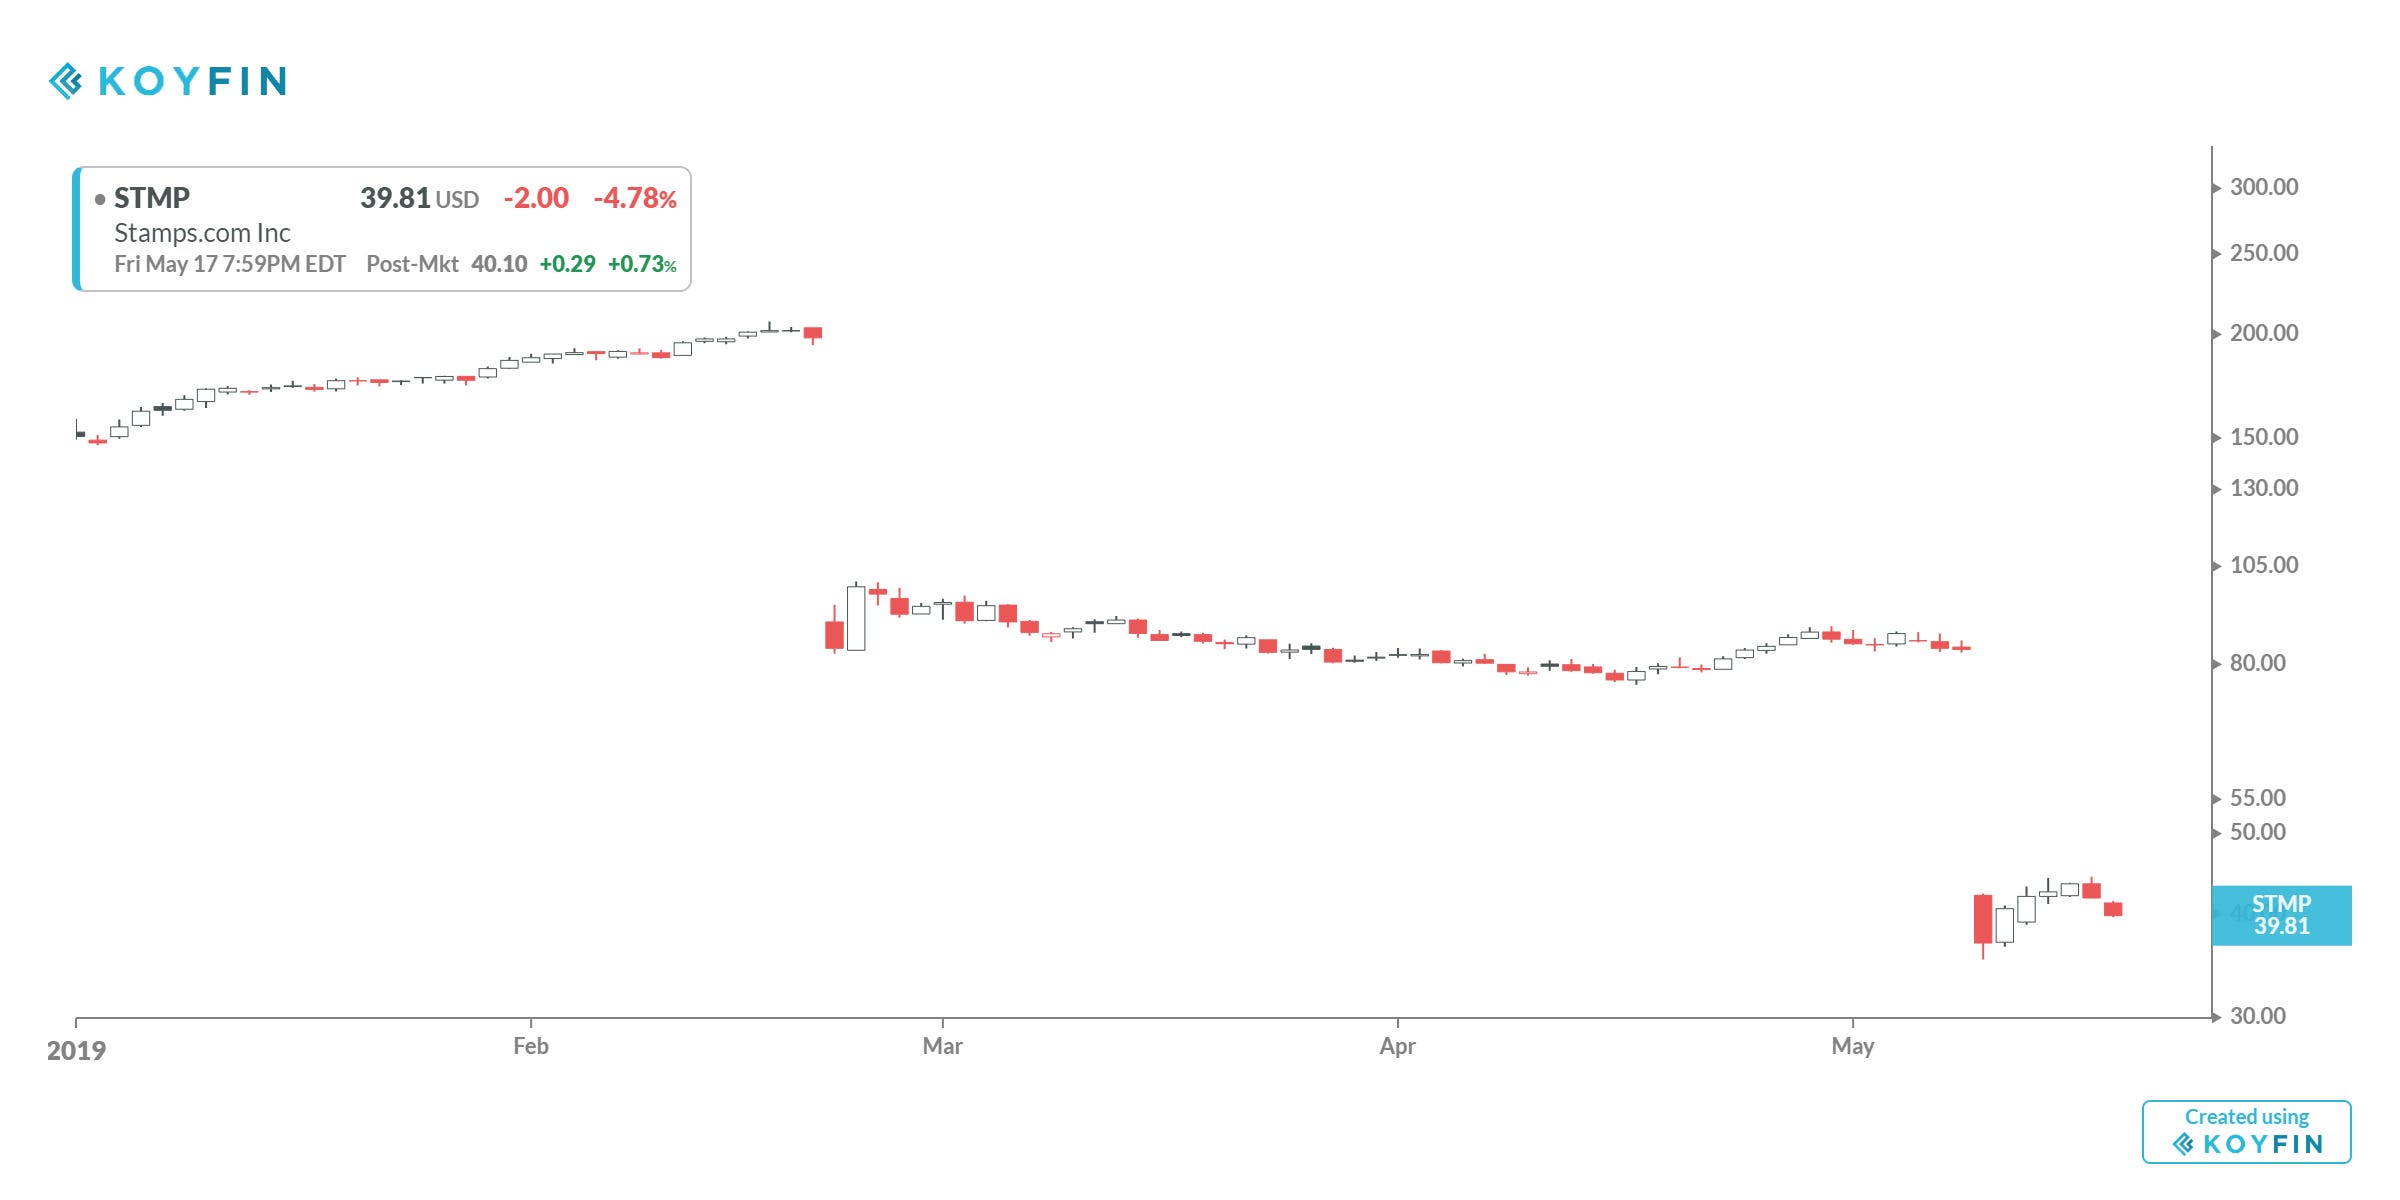
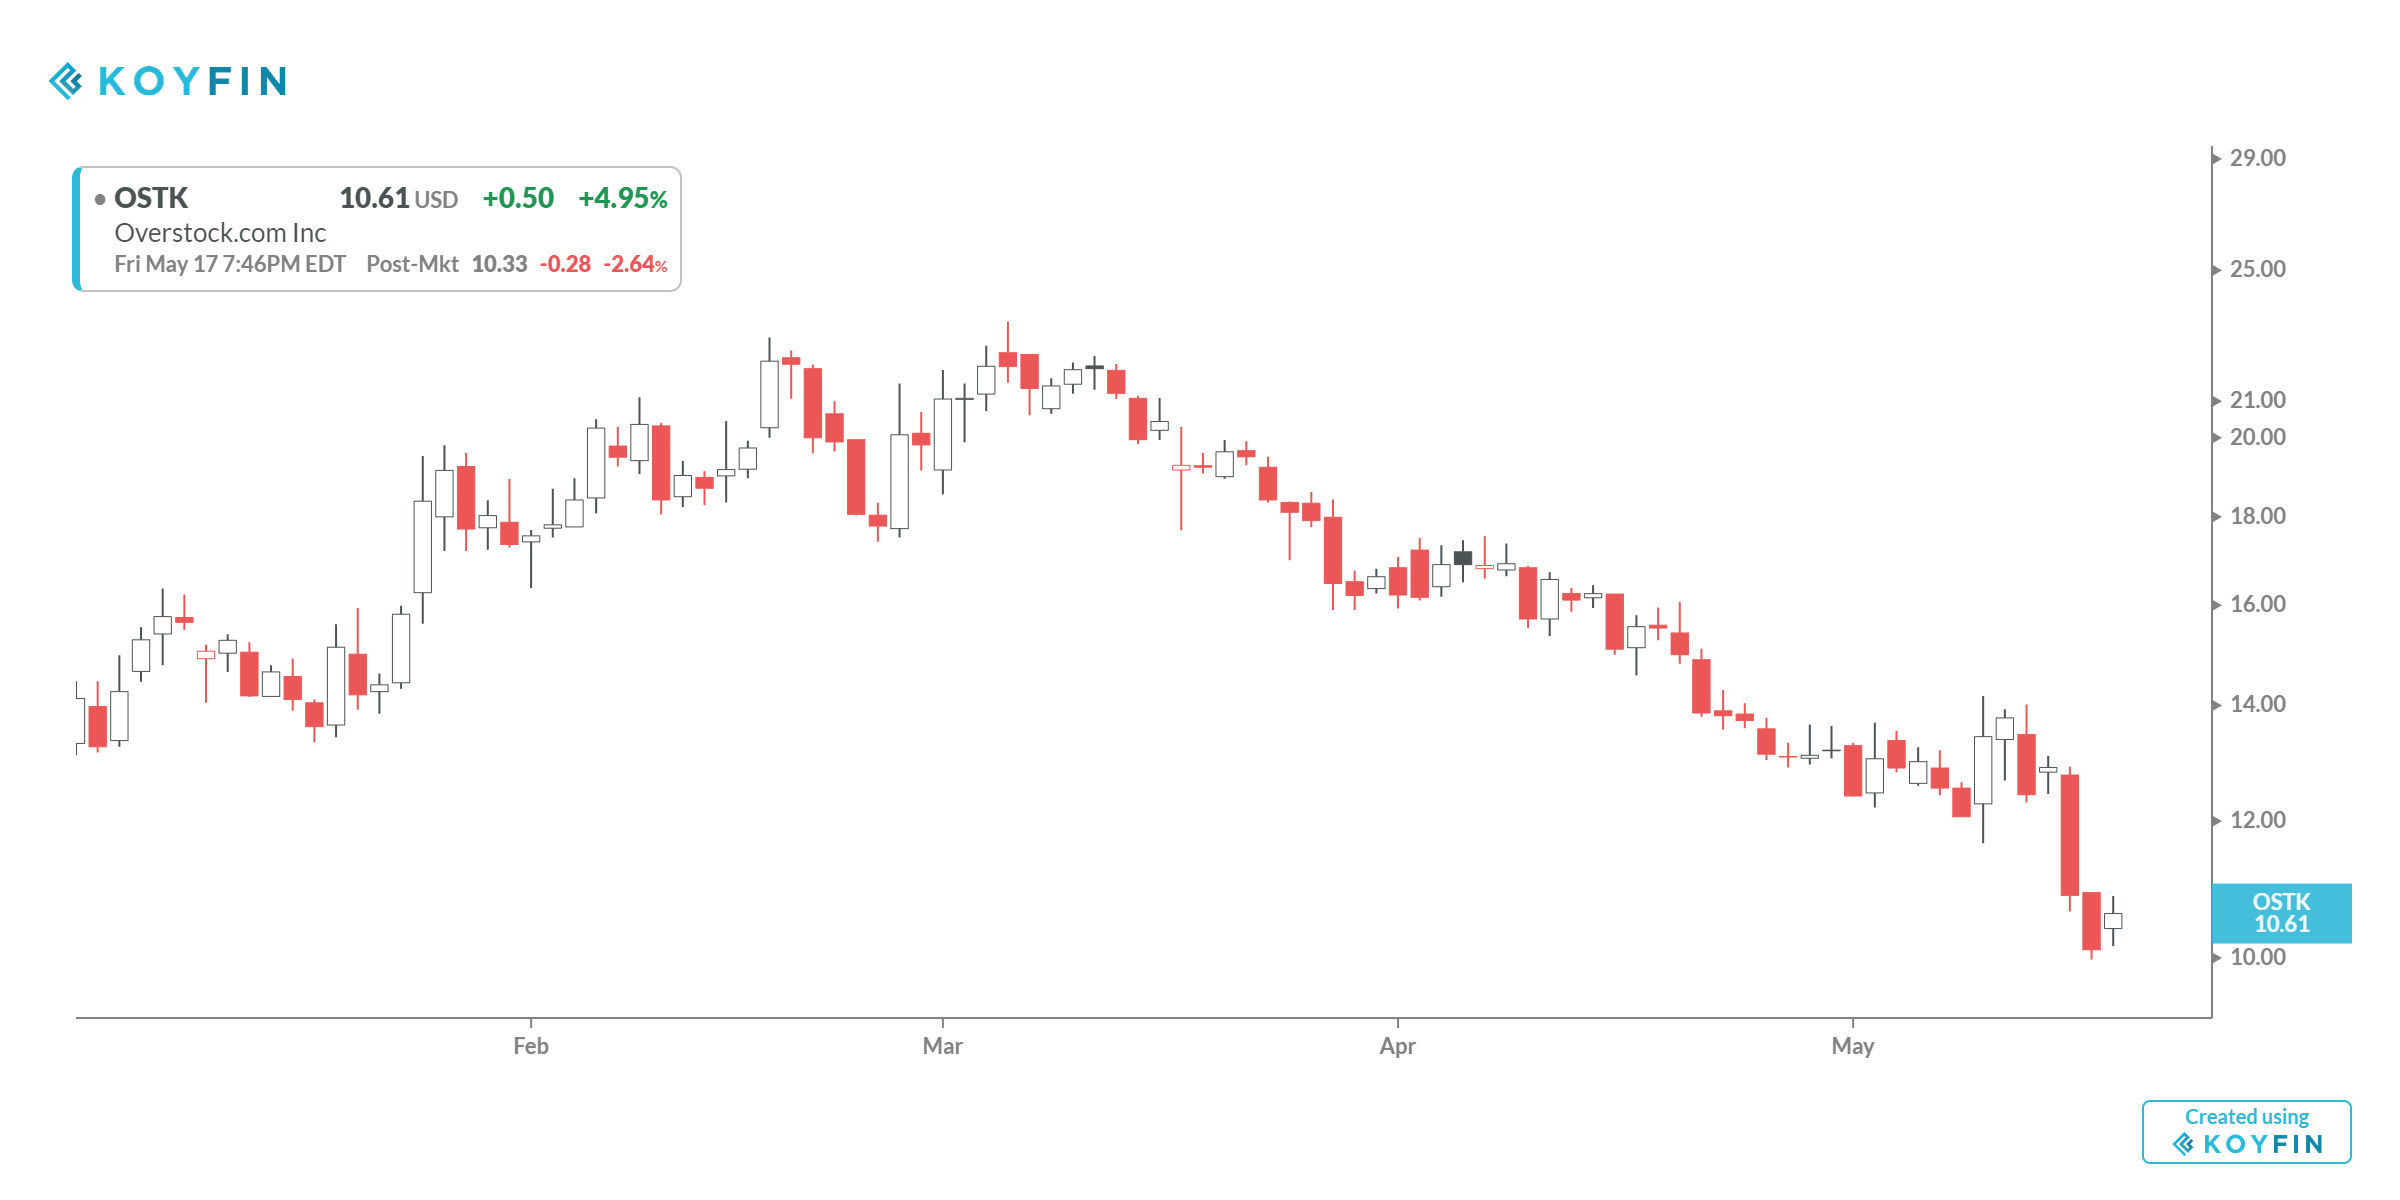
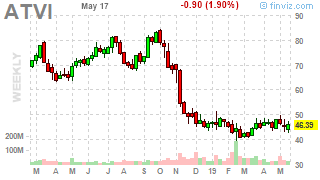
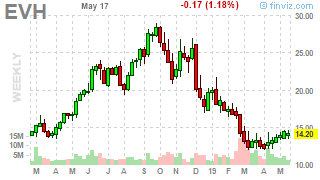
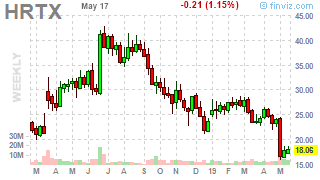
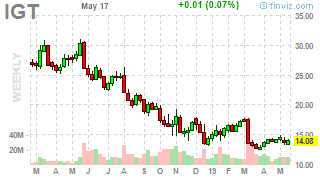
And now for the Top 20 SELLS (avoids and shorts). These were the top decliners on the sell / short side of price action.


Time for the “Worst 20” lists. We have seen what works, now let’s keep in mind what has not been working as either a long or a sell idea. Not all ideas will work.
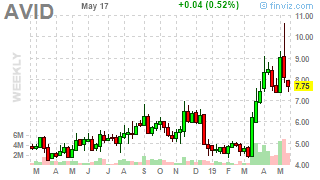
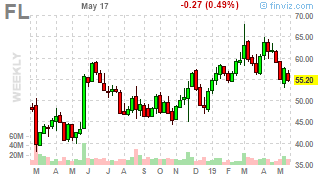
The Worst 20 long list is shared first. We may find a potential AVOID or short idea here that might work in H1’19 / H2’20. We won’t know for a while.


And now for the Worst 20 SELL charts. Maybe there will be bargains or bottoms here.


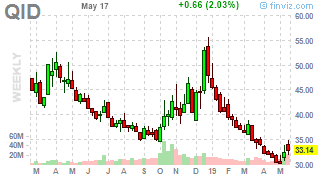
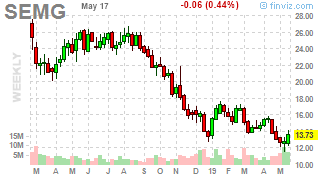


We may find a potential LONG idea for H2 ‘19/H1 ‘20 in this “Worst 20 SELL” list.
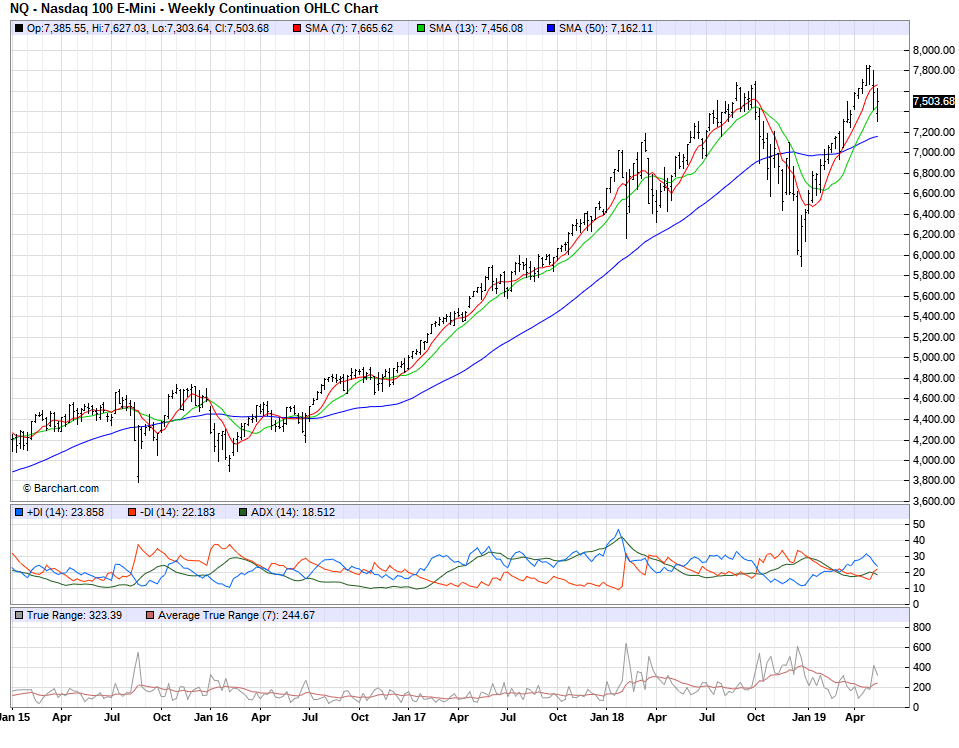
To close out this week’s update, let’s consider just a few futures / macro charts and then wish each other the best of luck in the coming week. We begin with Eurodollar.


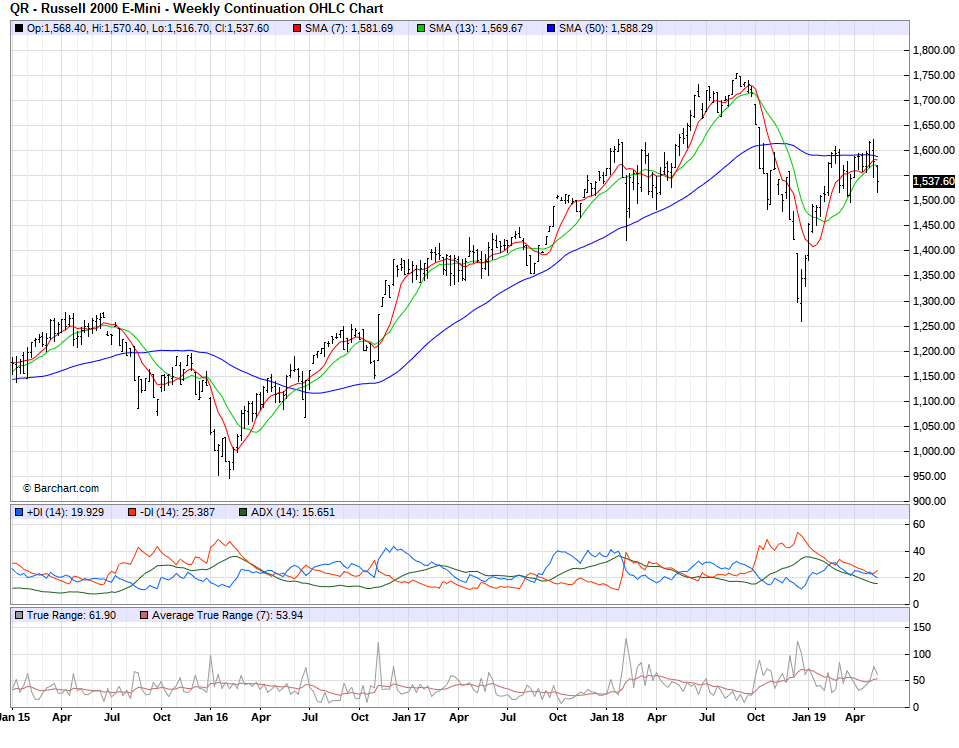


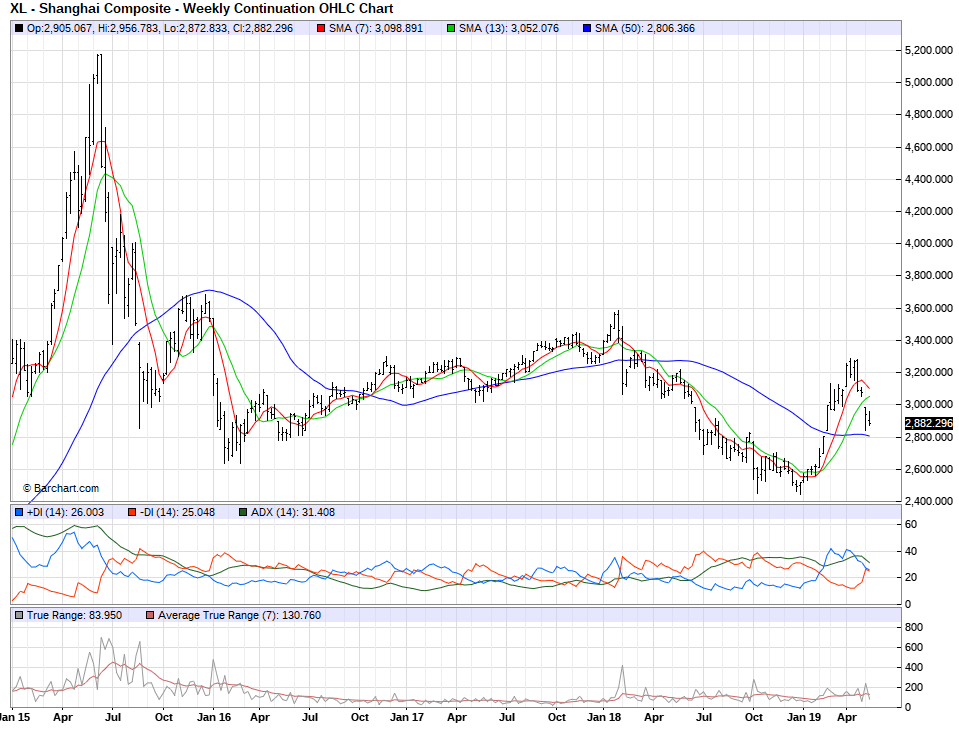
OK. Be careful out there. Have a good week and good luck. Updates over the next few weeks should be interesting.