


Trend Trading List of Suspects Update
Updates as Q1 2019 nears its end

This week’s update will include and update of the trend trading master ideas universe list resumed as of March 2019. The recovery on the long side for equities has been to put it mildly been robust enough to begin producing both long and short trend following ideas. Charts and list summaries will be posted below, along with some notes or observations about what I see from the charts.
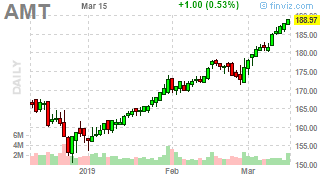
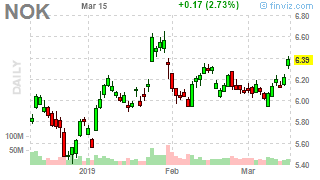
First to the Top 10 LONGS and Top 10 SELLS charts and Top 10 summaries.


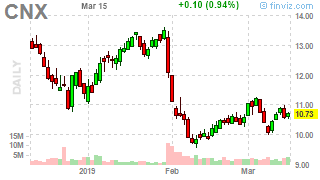
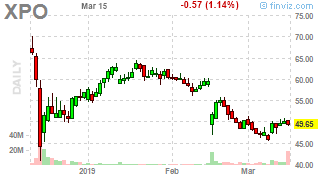
And now for the Top 10 SELL / AVOID / SHORT charts as of this week’s update.
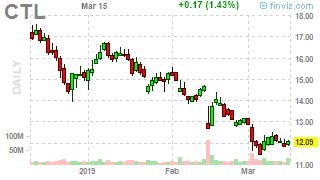
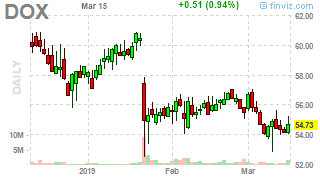


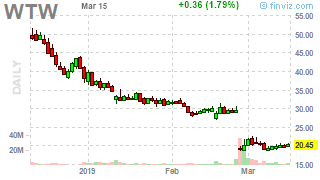

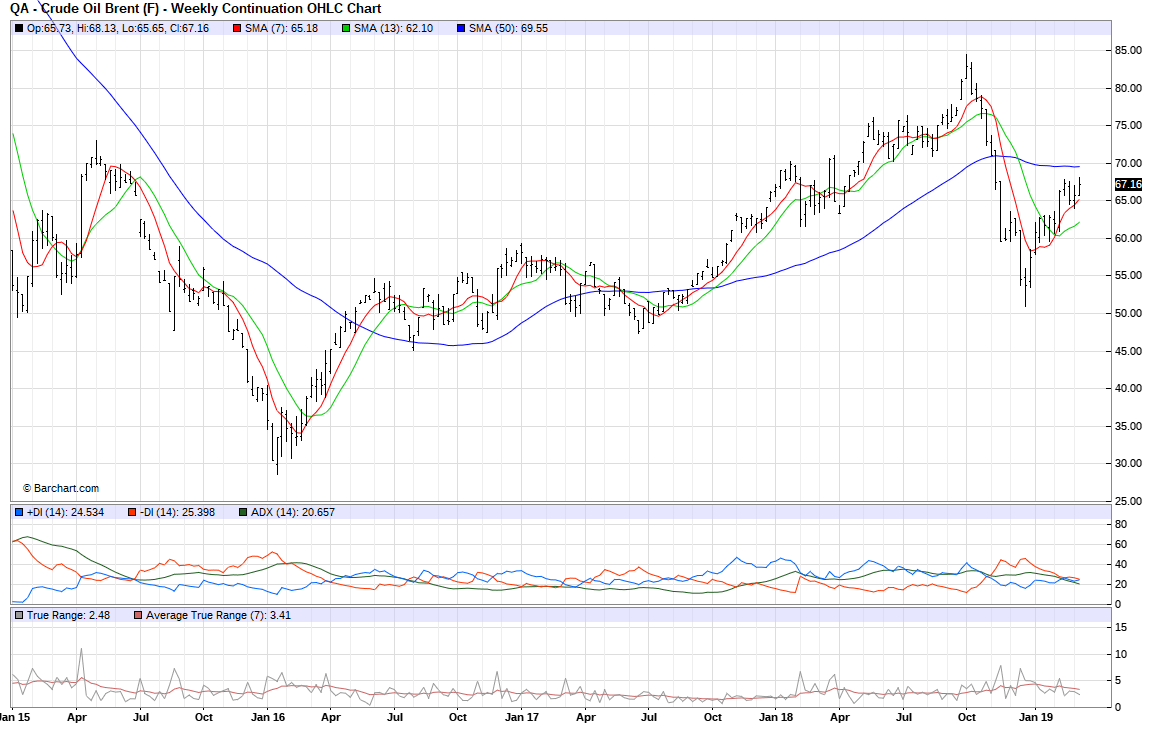
As we see most of these charts reflect well established up or down price action over several months. For the day and/or swing trader, money is made in shorter-time frames but those who prefer weekly prices and longer time frames, the potential exists for enhanced returns: either through appropriately sized positions or reduced losses by avoiding or reducing holdings of securities with declining prices.
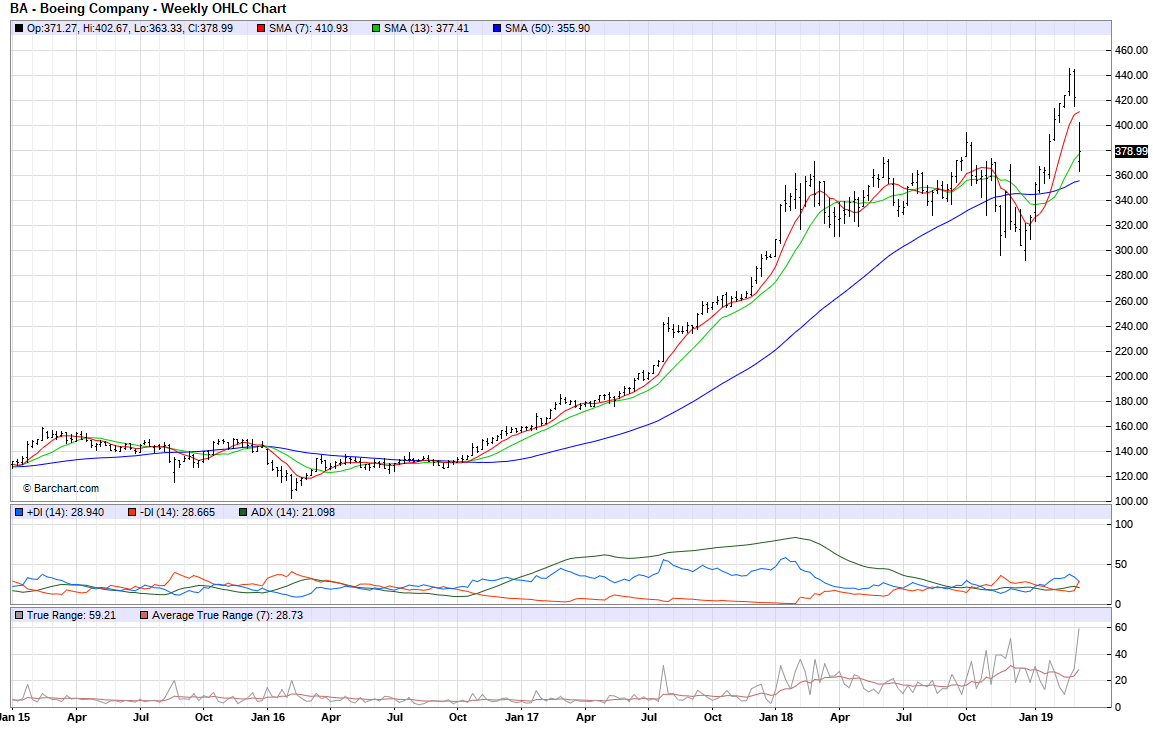
We have barely launched the new 2019 master ideas universe and we have two long ideas charts which have been stopped out. Boeing and Dick’s Sportings Goods. Many companies have faced crises which involved the tragic loss of lives - if they solve them, it will then involve negotiating a long road of earning trust. Investors must determine for themselves the risk and rewards and price paid and time necessary for them.

I want to move onto another cohort within the trend trading ideas universe, effectively the next set of 10 longs and 10 sells to consider. Combined with the above charts and list, they would comprise a “Top 20” leaderboard for this past week.


I wanted to highlight one issue about the charts we will see from this ideas universe. This is a trend following / trend trading /price following focused universe of ideas. We will not see some of the “hotter” charts that other traders have benefited greatly from, typically the mean-reverting, contrarian, or shorter-term swing trading variety. The charts posted here have usually approached new highs, or new lows. Many of the hot growth stocks which have enjoyed a wonderful V-shaped bounce, like in “SaaS” or elsewhere won’t be visible perhaps for at least another quarter. Perhaps they will join the list in Q3/Q4 2019 due to the long time frames involved.
On to the NEXT 10 SELLS / AVOIDs charts.


And now for your review, a broad top down list of the trend following ideas both long and short to consider and factor. Trade sizing recommendations have been offered to help you figure out trade sizing via “risk per share”. (Divide your planned capital risk for a trade by “risk/share”; e.g. you risk $100 USD/ (risk/share) to calculate trade size.)
For those of you who are new to Rooster360, this is NOT a very big list. This list used to scale to about 1000 ideas on average. After Q4 2018, most of the longs were “invert ETF” type ideas and the list was dominated by the same ever declining ideas. The cue to “leave” or stand pat or sit on hands (or whatever “do nothing but watch” metaphor) was in place last quarter. There are some potential green shoots already but we’ll see.
NOTE: Master List removed for updating, please see most recent update for new list.
And now for some other thoughts.
Take your time, don’t stress. Review your trading plans. Take your losses or lumps. Move on and assess. Risk management is a real thing. Please stop making fun of it. Struggling and stress is no fun. I see too much ridicule of those who mention it as if it shouldn’t be mentioned. I will keep harping on it, as my mentor did it. You take in enough risks in life, so make sure risks that you do choose don’t “take” you out.

Adam Robinson on copper: ““Metal traders have not been wrong once, in the last 18 years, in regards to the direction of interest rates””

The total stock market view via no-frills Vanguard proxies shows the bounce.

And now for some relative view charts, thanks to the ideas of Adam Robinson.
A warning, various chart crimes are committed when you make these kinds of charts or any kinds of charts (e.g. “hey that’s NOT a Log chart… etc.”). p.s. Koyfin is great!

First chart is LQD vs. IEF (corporate vs. 10 year ETF). This is only a trailing 1 yr chart. You stretch out the chart to longer time frames and it looks different. I just wanted to see how Mr. Market was “feeling” via the bond view (via the stock jockey ETF view!)
Q2 2019 is the quarter to watch and take extra risk in if you’re inclined. Do we get more juice to squeeze out in Q2, or are we about to see profit taking dent returns?
Have a great week ahead.