Summer Weekly Update 8/25/2018

Some housekeeping first. In a few weeks, Rooster360 will finish its transition to the Substack platform by Q4 2018. BUT the ideas will continue to be posted, just at a new home on Substack. I have already written to readers about this and nothing changes, there will still be charts, ideas and brief commentary based on Rooster360's trend following process. And there will be a Trend Trading "ROOM" on the StockTwits platform launched as well. If you're a StockTwits community member please consider getting on the waiting list. Y
Subscribers to Rooster360 will be alerted with updates on new weekly updates and posts, so there's nothing for readers to do. If anything, please reach out to me and send me your charts or ideas for review (again, no price targets), and I will do what I can to comment publicly in future updates.
And a separate site, focused on history, market trends and technology, The Big Stack will also be moved to Substack and have its own "ROOM" on the StockTwits platform as well.
Things keep changing every day but the habits and reasons for what we do remain the same.
Let's jump to this week's updates, the STOPPED ideas, LAGGARD and TOP 20 updates, along with weekly charts. The first report is for STOPPED OUT ideas.
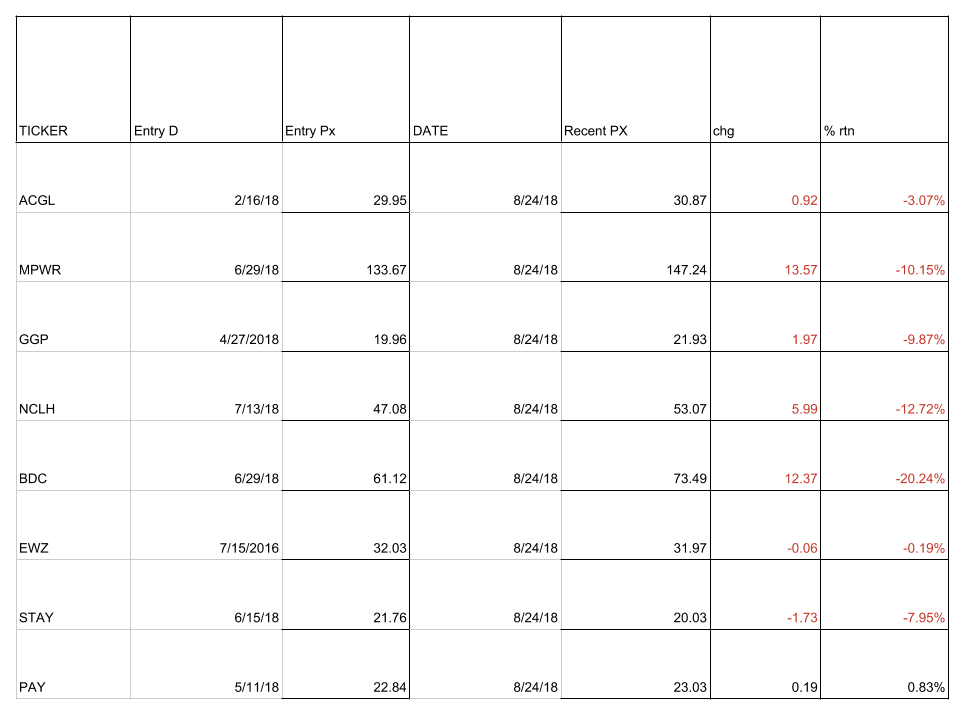
It's bracing to see charts that seemed so promising on this list. I refer to Brazil but it should come as no surprise that emerging markets have been under the hammer for some time.


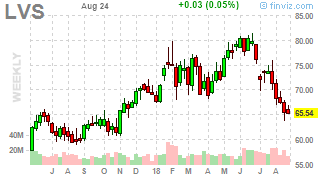
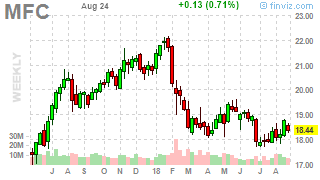
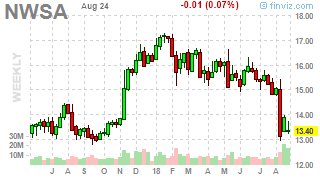
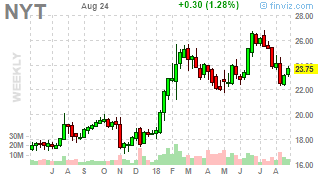
Let's go to the LONG laggard charts next. I see media companies (NWS, NYT) and one gaming juggernaut (LVS) are among the long ideas currently under pressure in recent weeks. This report covers the LONG ideas currently under-performing but not yet stopped out.


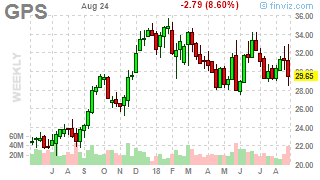

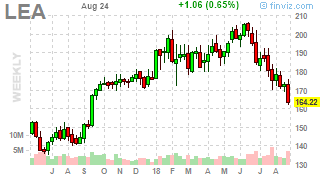


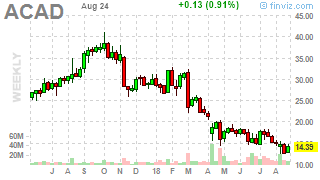
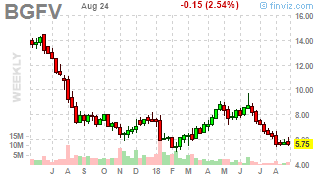
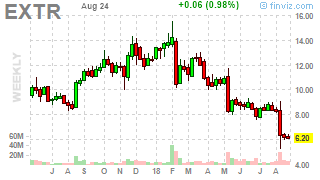
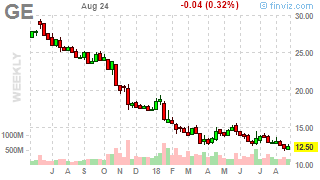
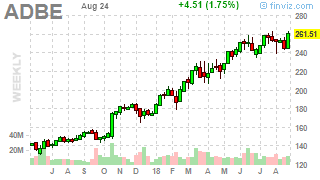
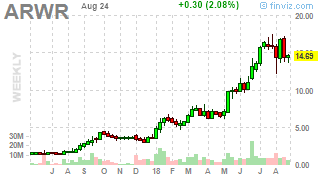
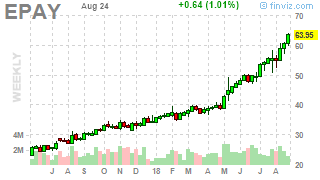
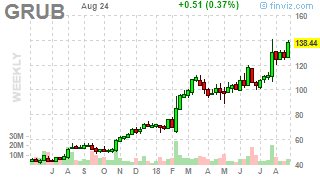
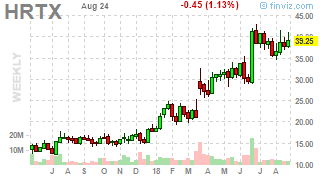
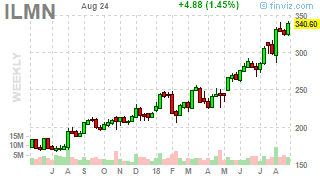
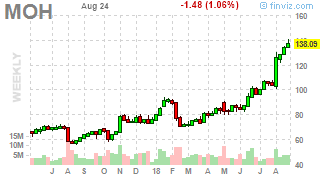
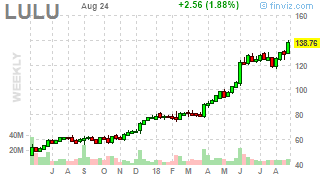
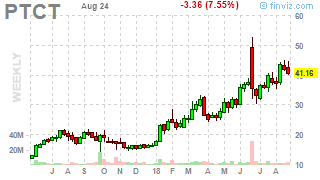
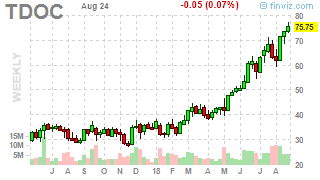
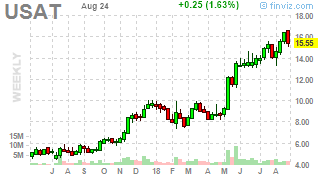
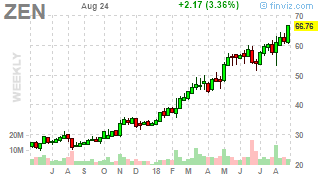
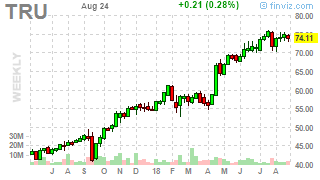
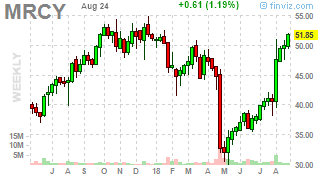
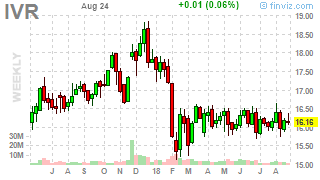
Let's jump to the Top 20 leaderboard, beginning with the SELL/AVOID charts and then the LONG leaders. Whsen a knife falls, it can do so for seemingly an aeon. We have all been there. We cannot will price action into existence. Mr. Market does what he wants, so control your risks and always lean on your process and plans.
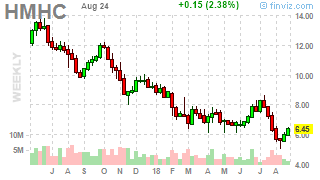
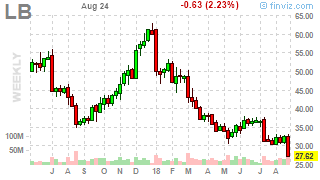
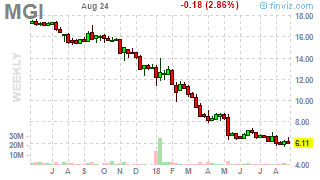
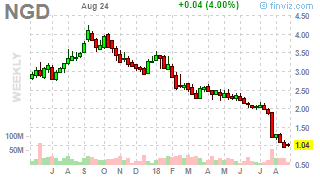
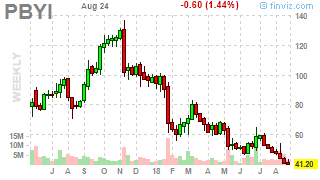
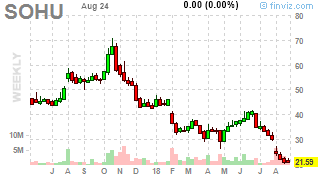
The following Top 20 SELL/AVOID charts continue to counsel against knife catching.