


Summer Review H1 2019
Trend Trading and H1 2019 Update

And just like that the first half of 2019 is done. Remarkable and frightening how quickly time passes and how markets can shift in sentiment and price action. We went from the “end of the trend” in Q4 2018 to new heights. 6 months ahead seems like an eternity before it becomes something that is in our rear view mirrors.
There will be no update next week’s July 4th shortened weekend. I wanted to wish all a pleasant, safe, healthy and happy time, and say thanks to all of you, some new, some who have been reading for the last few years - it means a lot to me. Let’s get to it.
The Top Down Summary is not too different from last week’s top down update.

Last week’s top down summary shows a slight softening in profits from last week.

The week also included more stop exits of SELL ideas and only 1 LONG idea, COG.

First up is the Top 20 leaderboards and relevant charts.
Here are the updated Koyfin Dashboard lists for the Top 20 Longs and Sells for those who use Koyfin’s great financial service.
The Rooster360 Top 20 Trend Long on Koyfin
The Rooster360 Top 20 Trend Sell on Koyfin
The Top 20 LONG List as of this week remains the same.

The Top 20 SELL list is also close to last week’s update

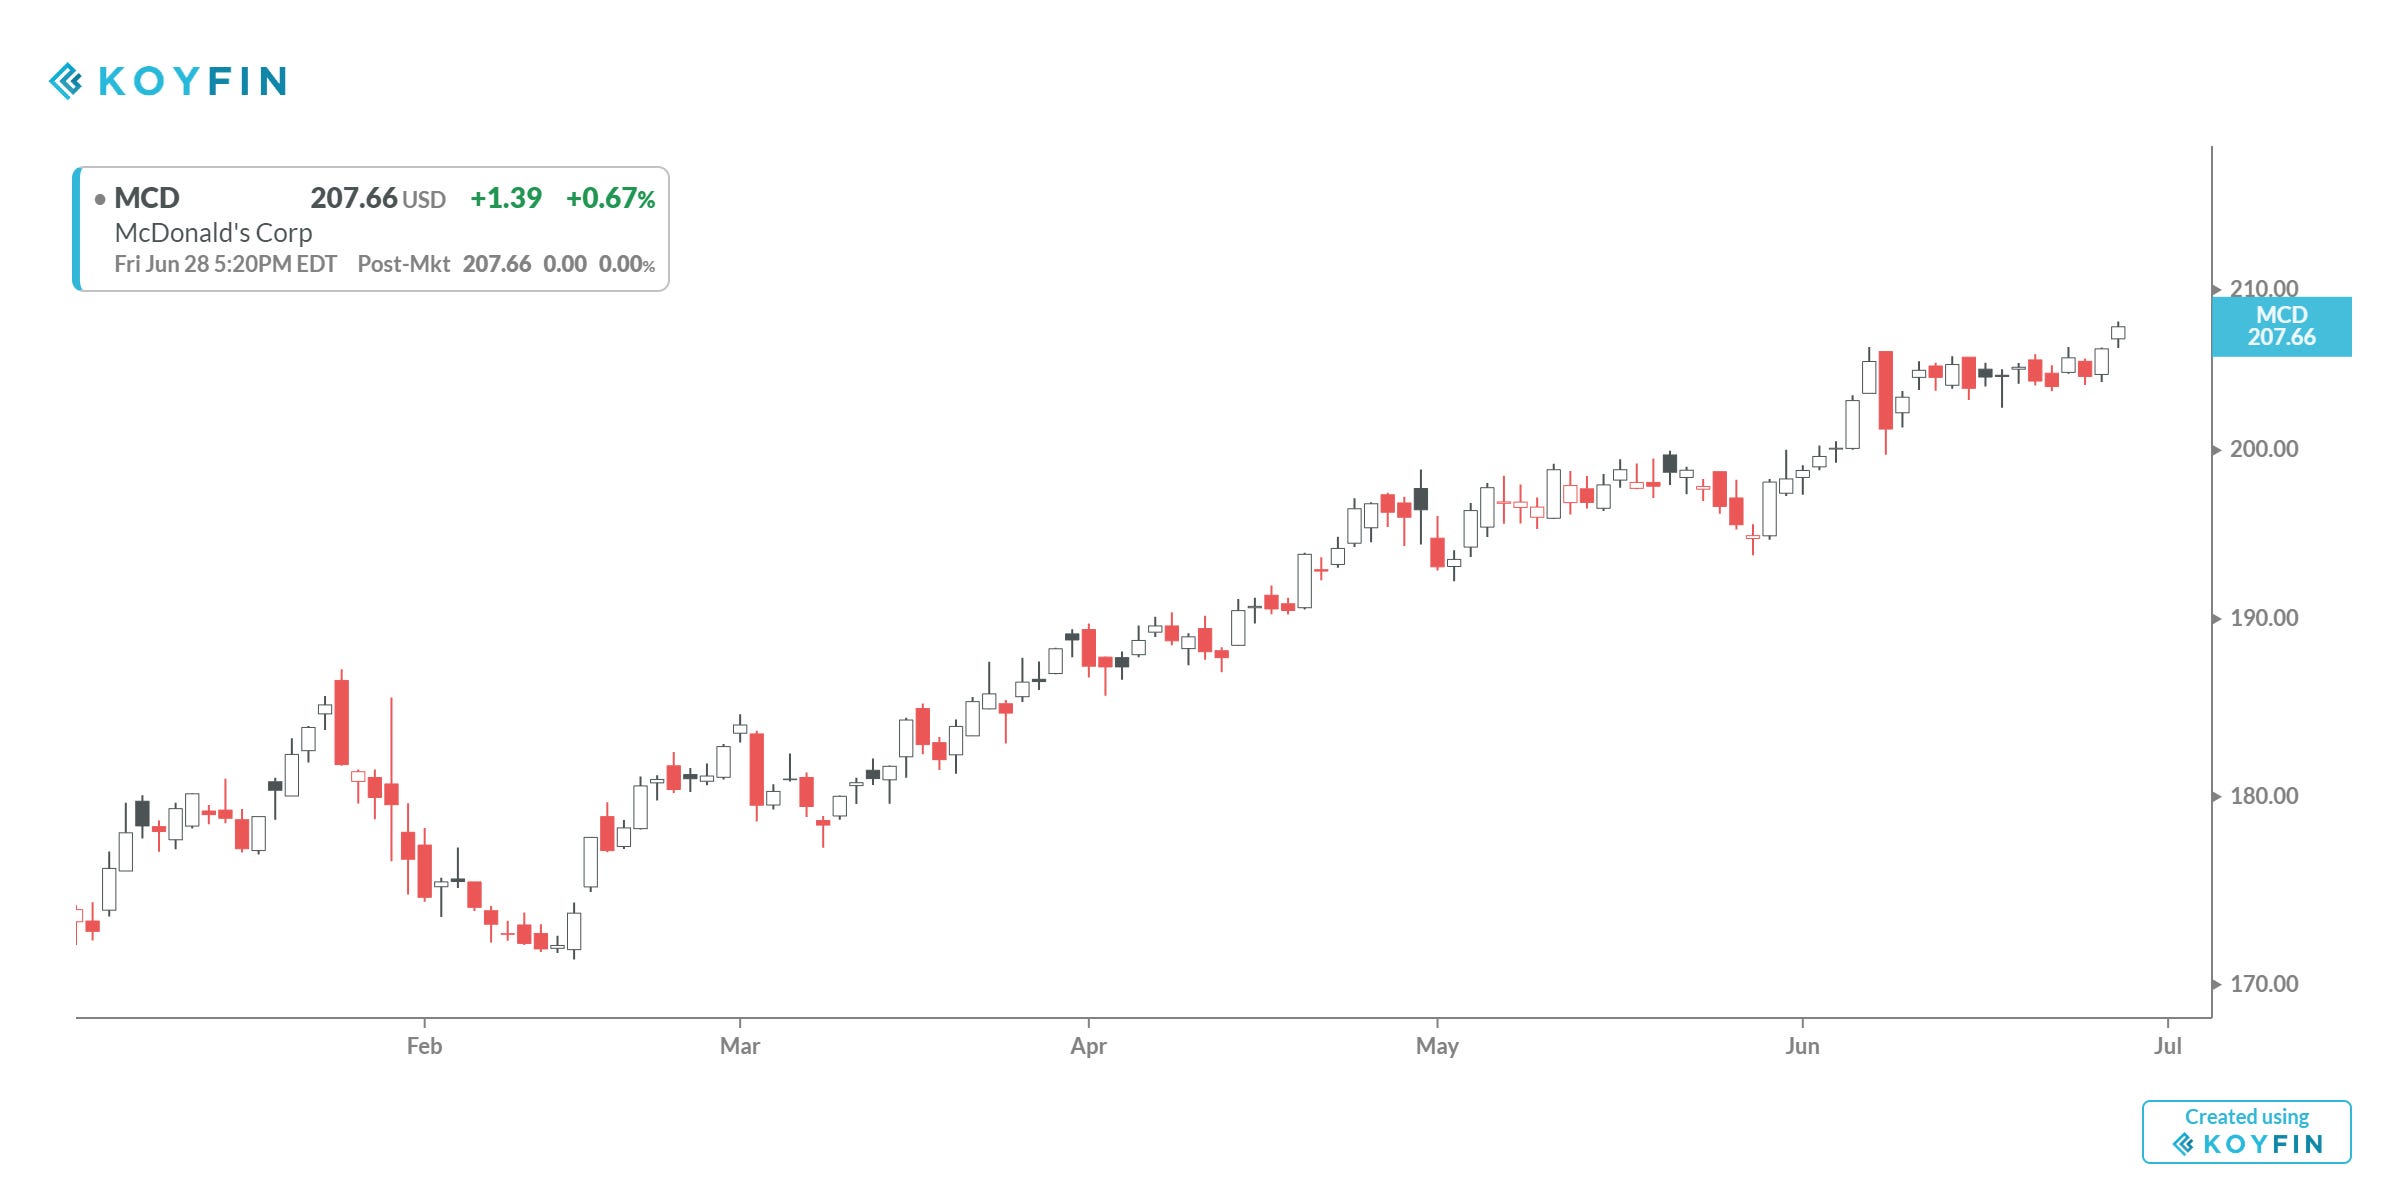
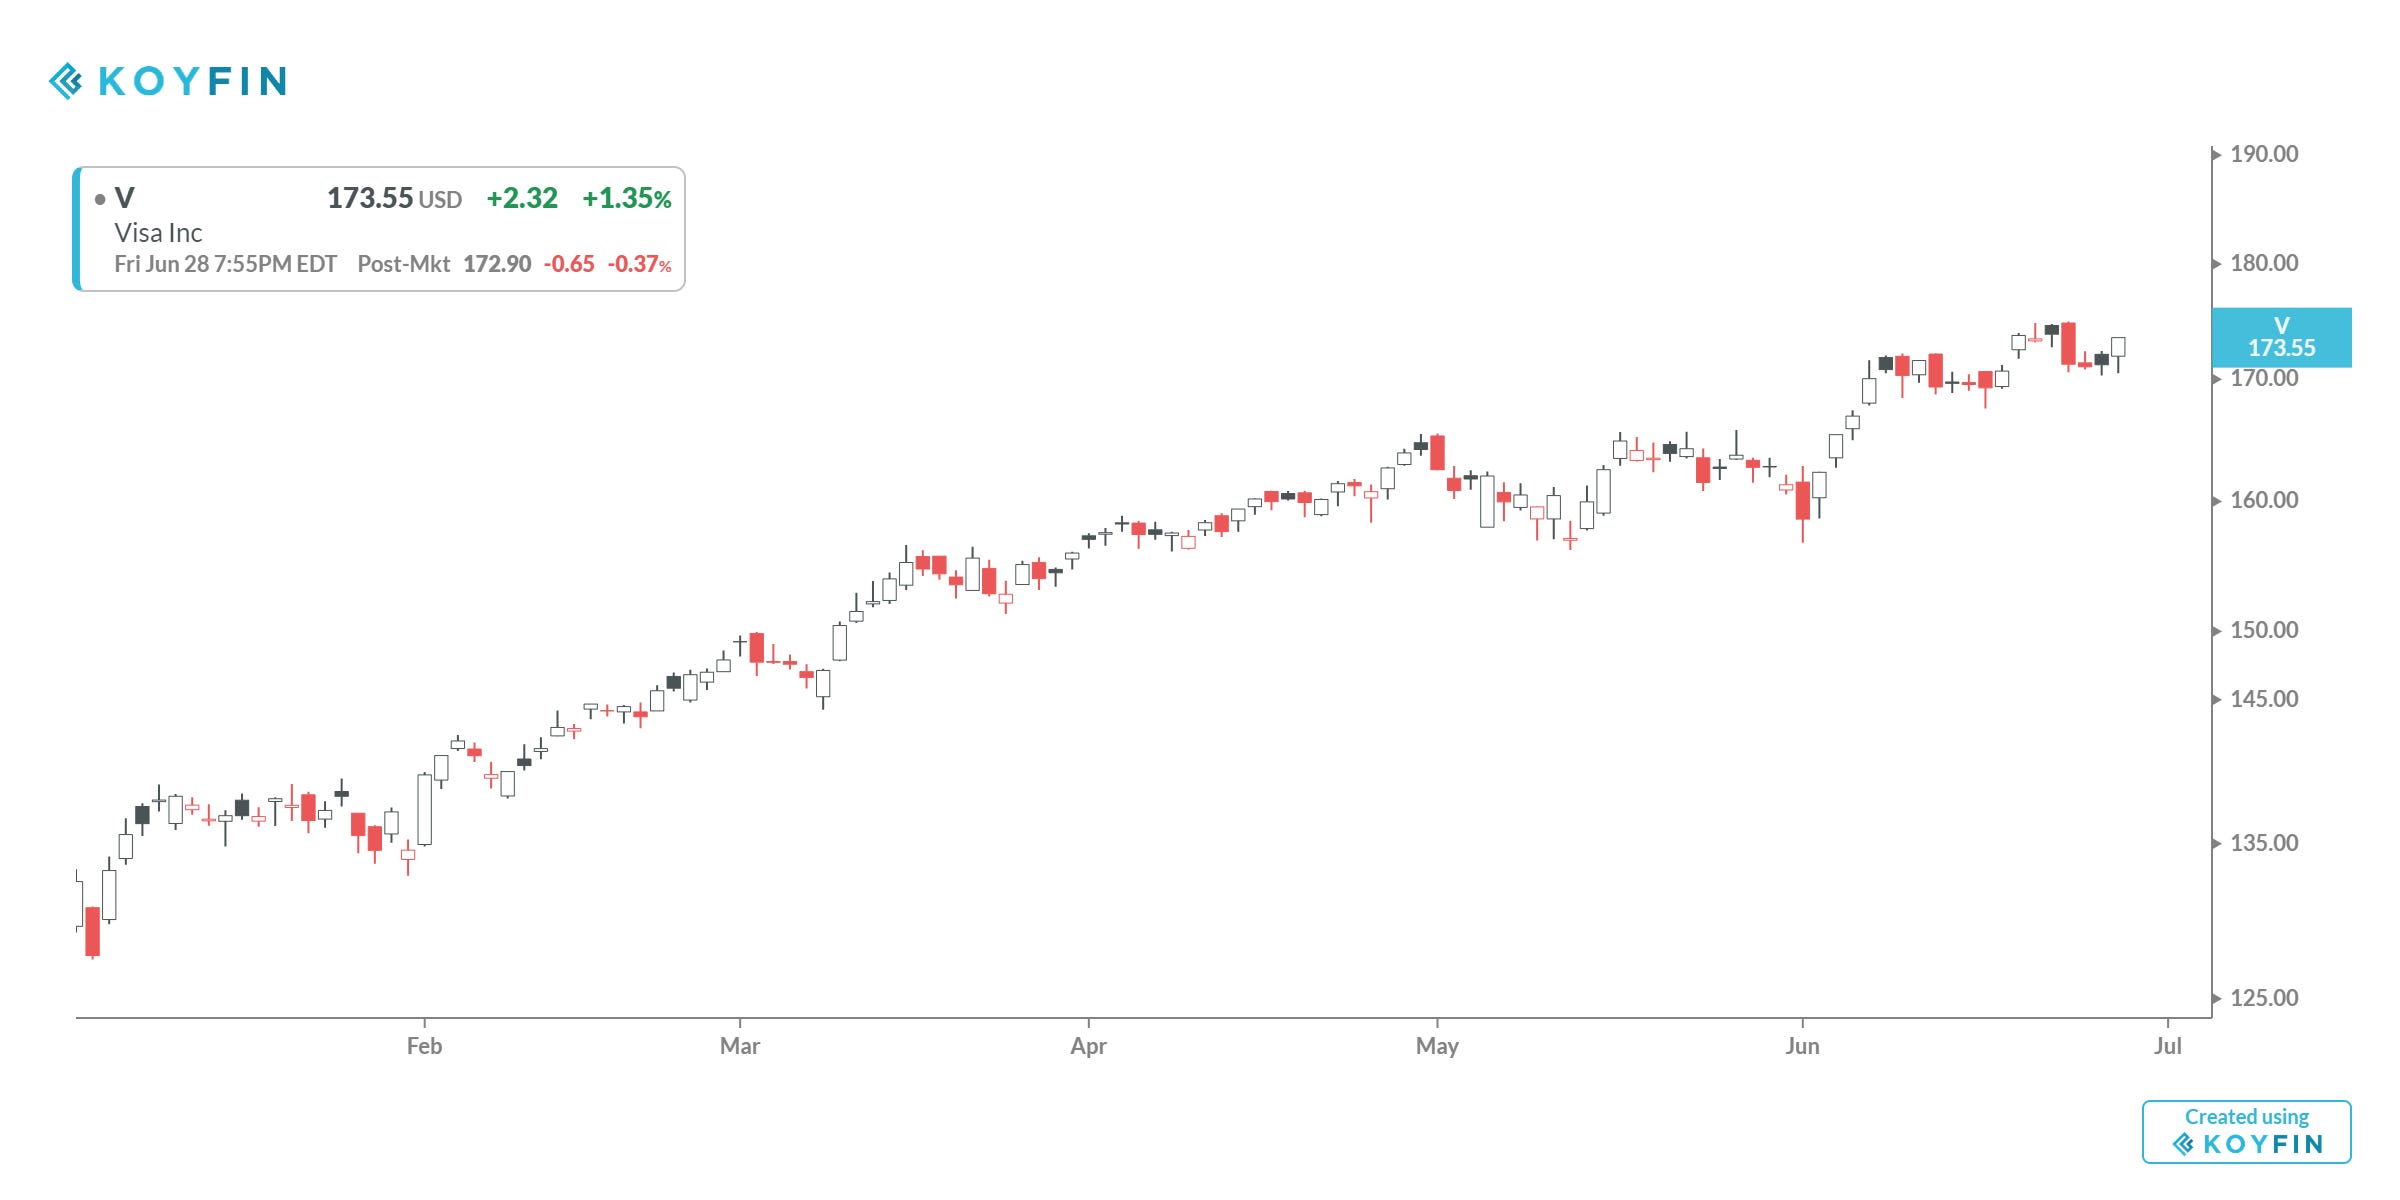
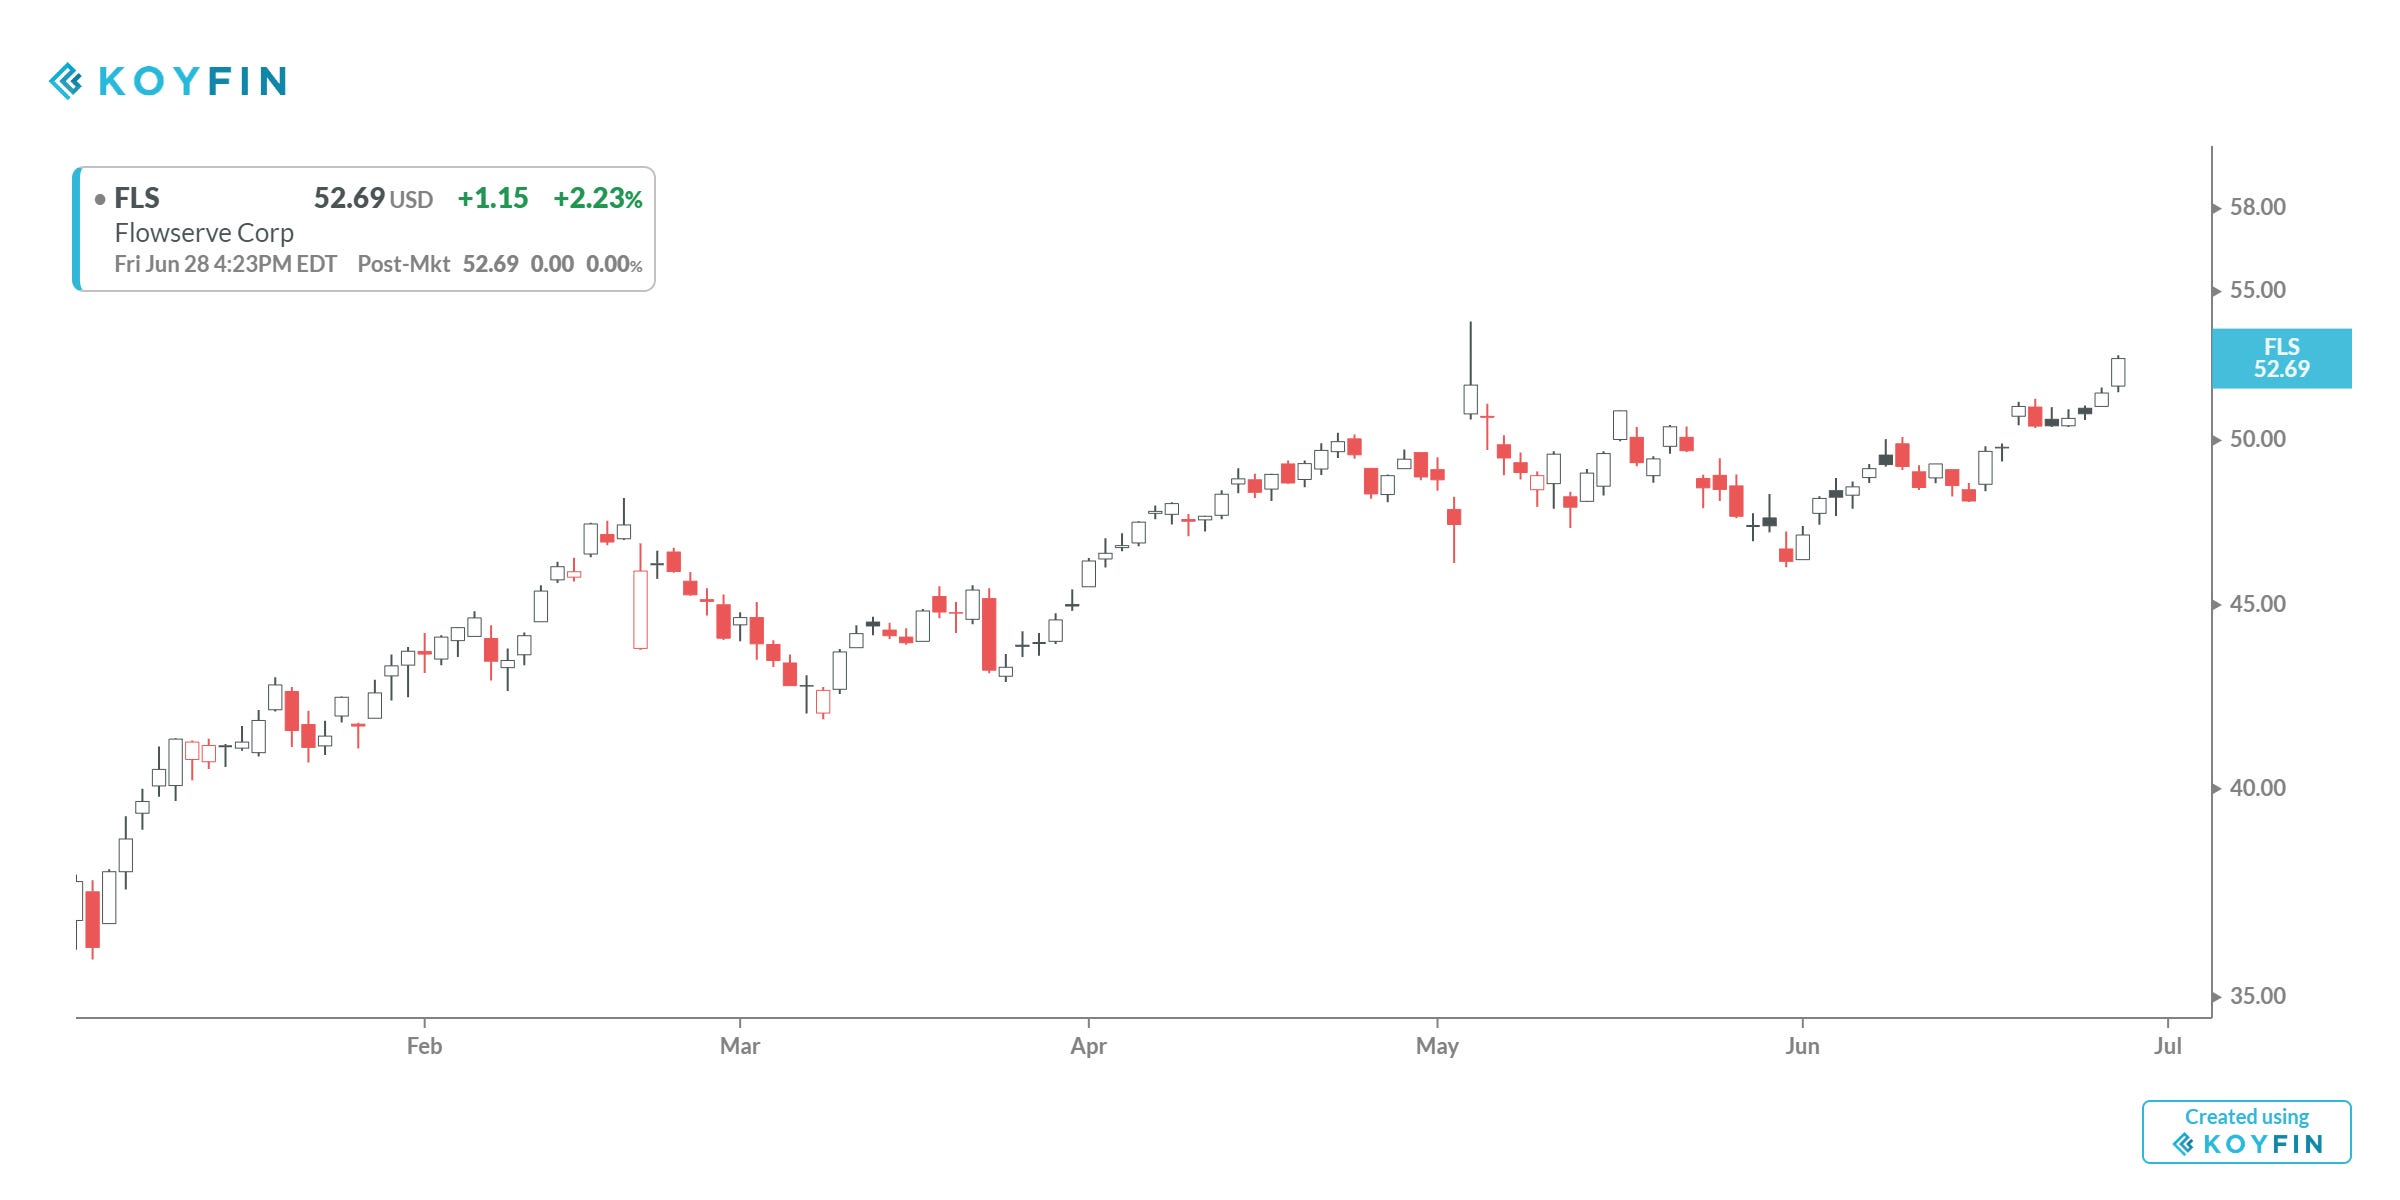
Let’s just focus on some of the charts from these lists via daily price charts for a close up view. As we see most of the ideas were introduced when the list was restarted in March 2019, after waiting out the Q4 2018 decline, and returns for the best ideas have been remarkable.
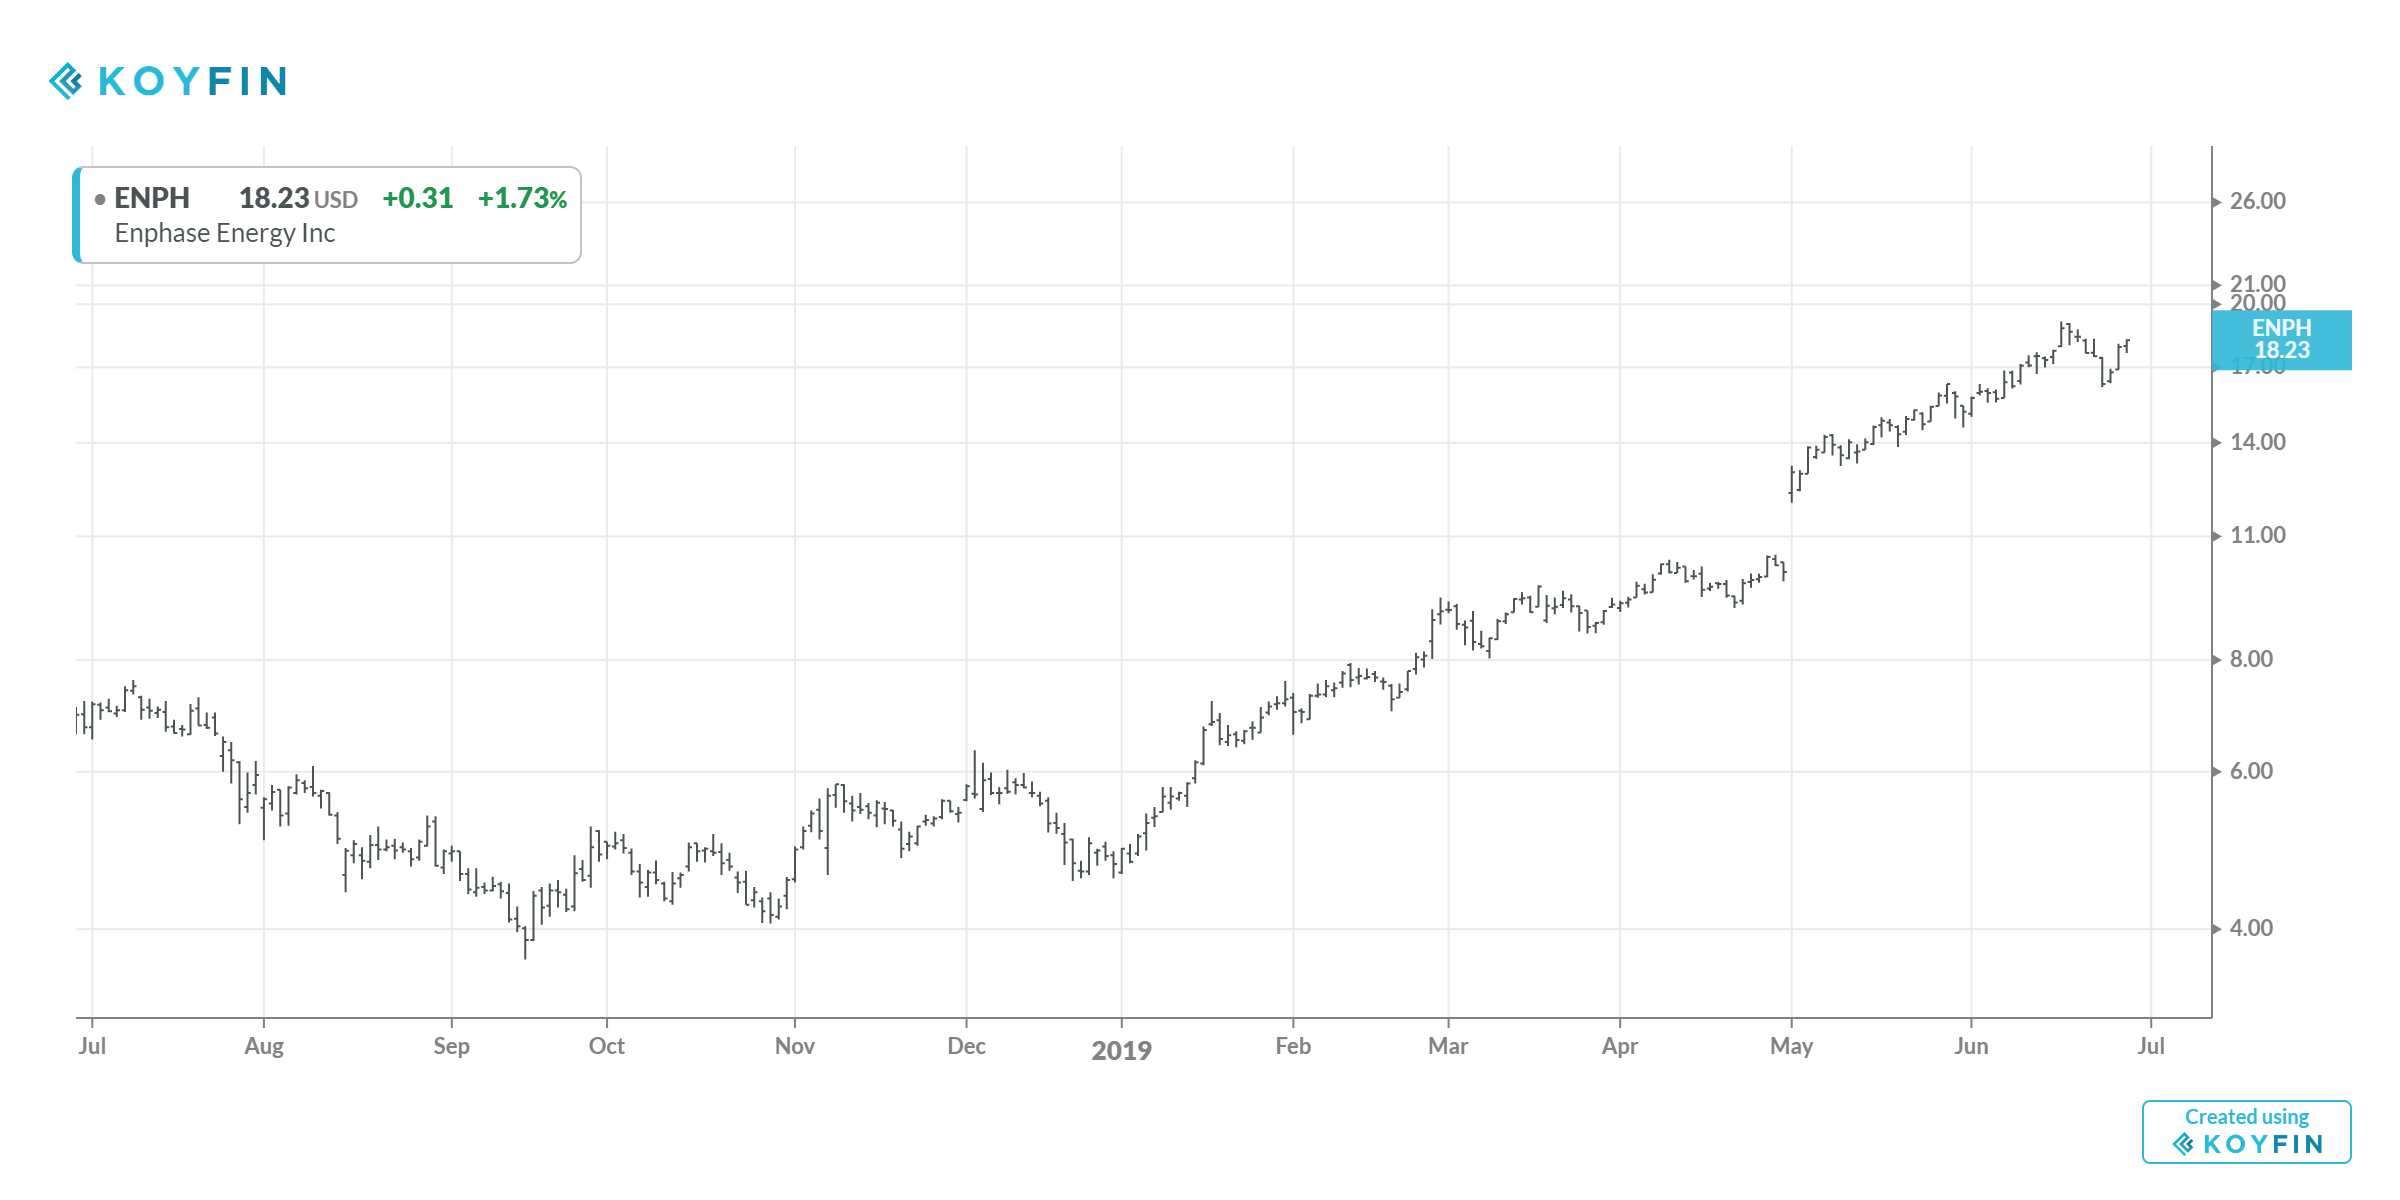
Long charts first include ARQL - new highs on a trailing 12 month basis.

ENPH likewise has been equally impressive.
When Shopify was added in mid-March 2019, it seemed “late” but it kept running. There just is no telling. I understand that some are searching for “reasons” but they will only become apparent when looking back. Right now the platform has gone to another level as a business and will be the go to service for many small DTC newcomers.

Skipping further down the list to TSS - this has been running for so long. We can see it from these 2 charts, a YTD and a 3 year view. If only all ideas were like this one.

See what I mean by the 3 year chart? If you adjust for the trading ranges, you can “ride” out some long running trends which overlap with “buy & hold” practically.

Veeva is another great example. Again a YTD and 3 year chart.
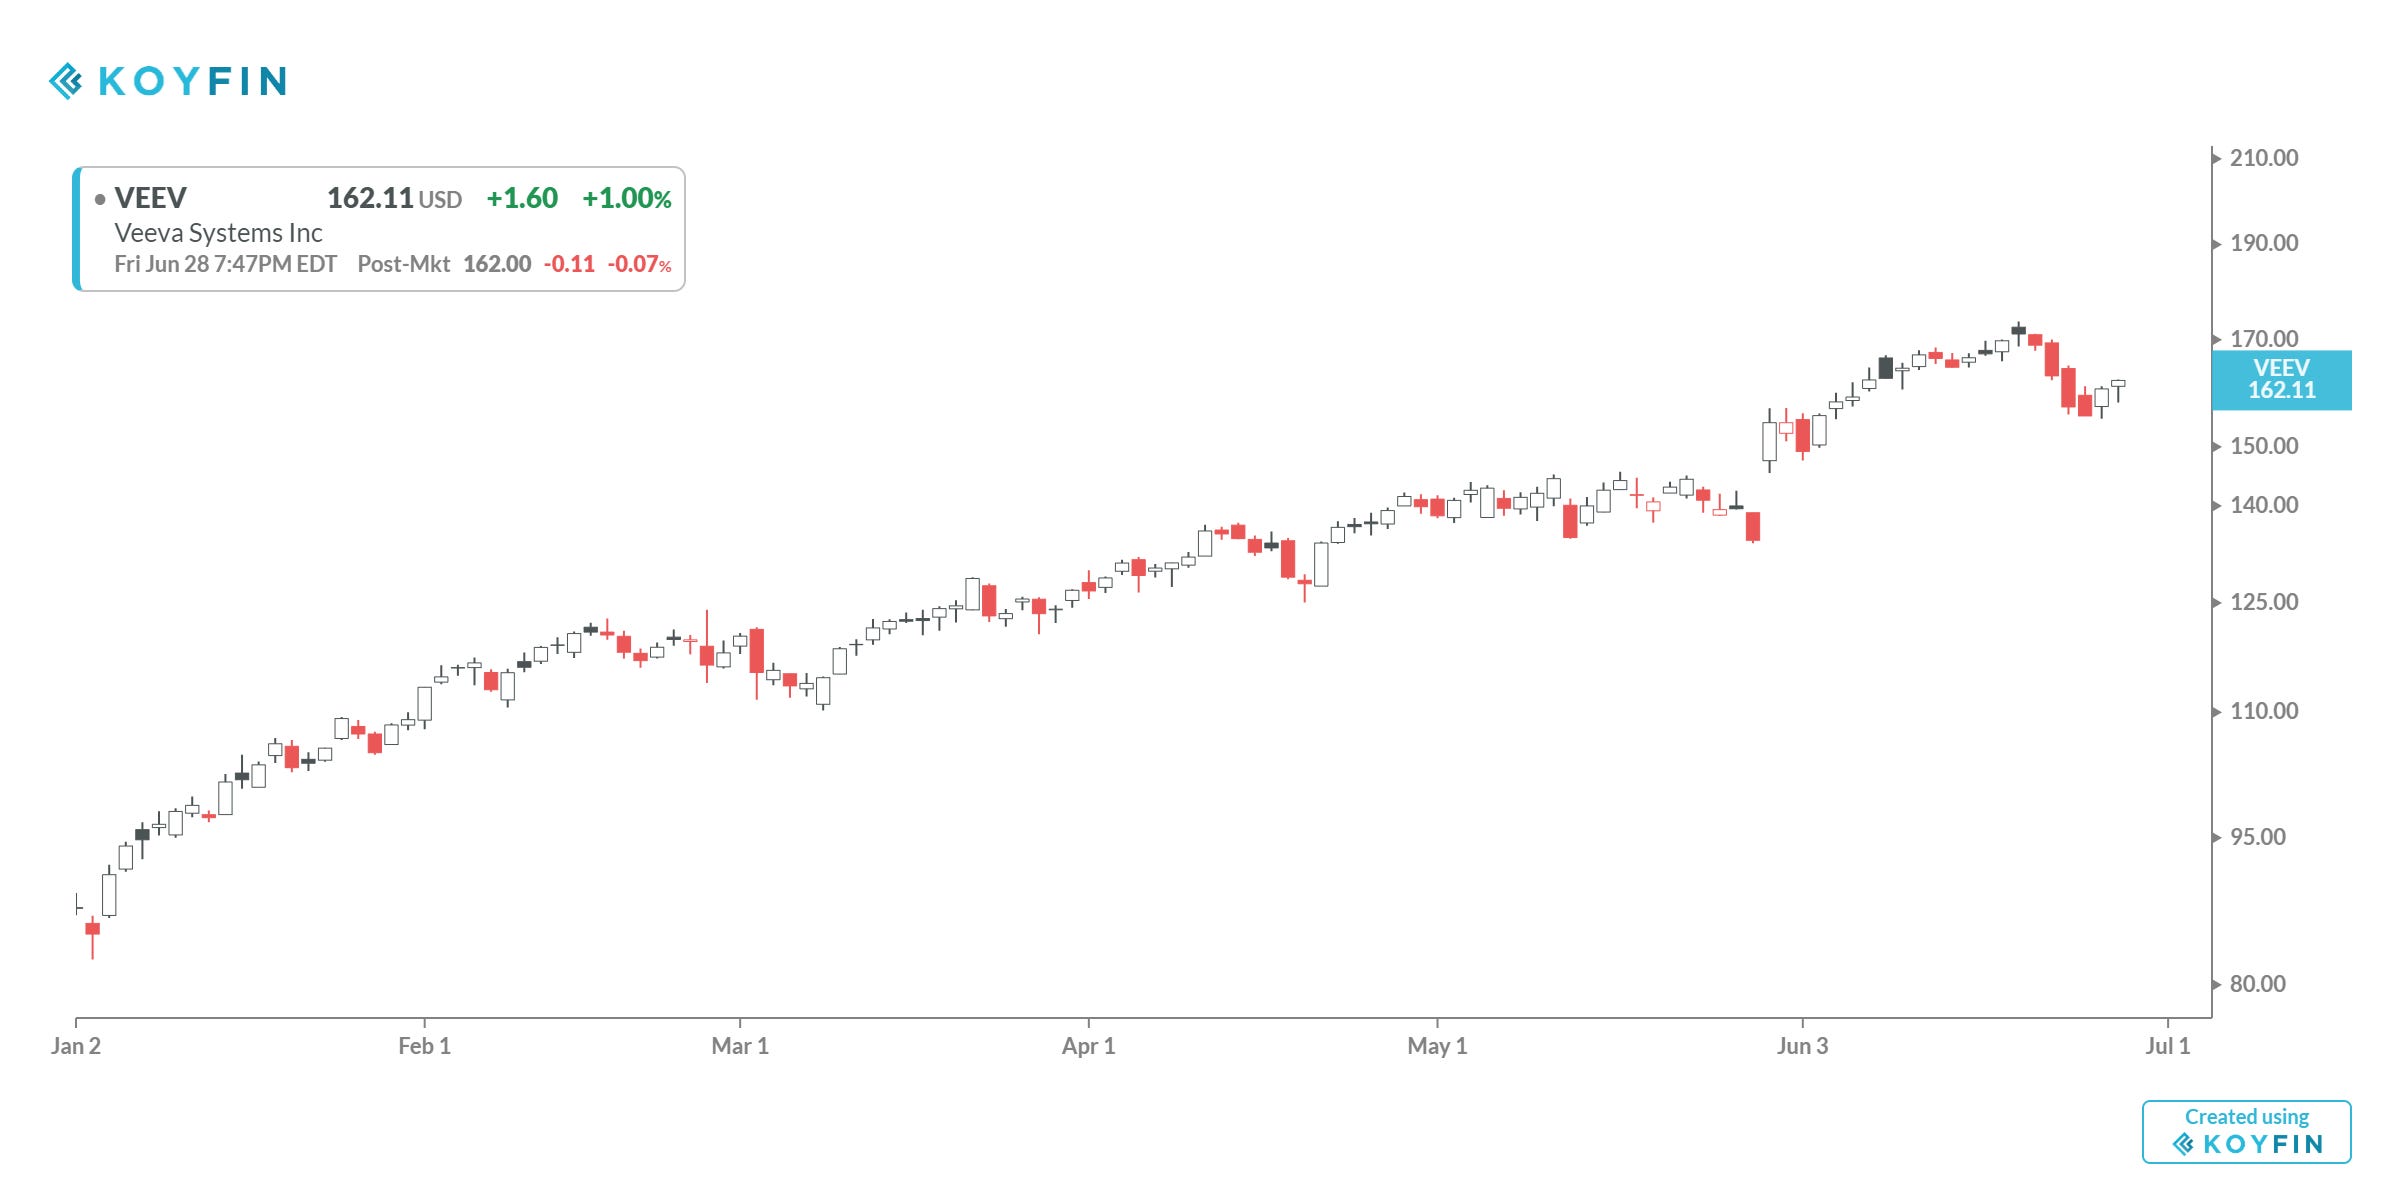
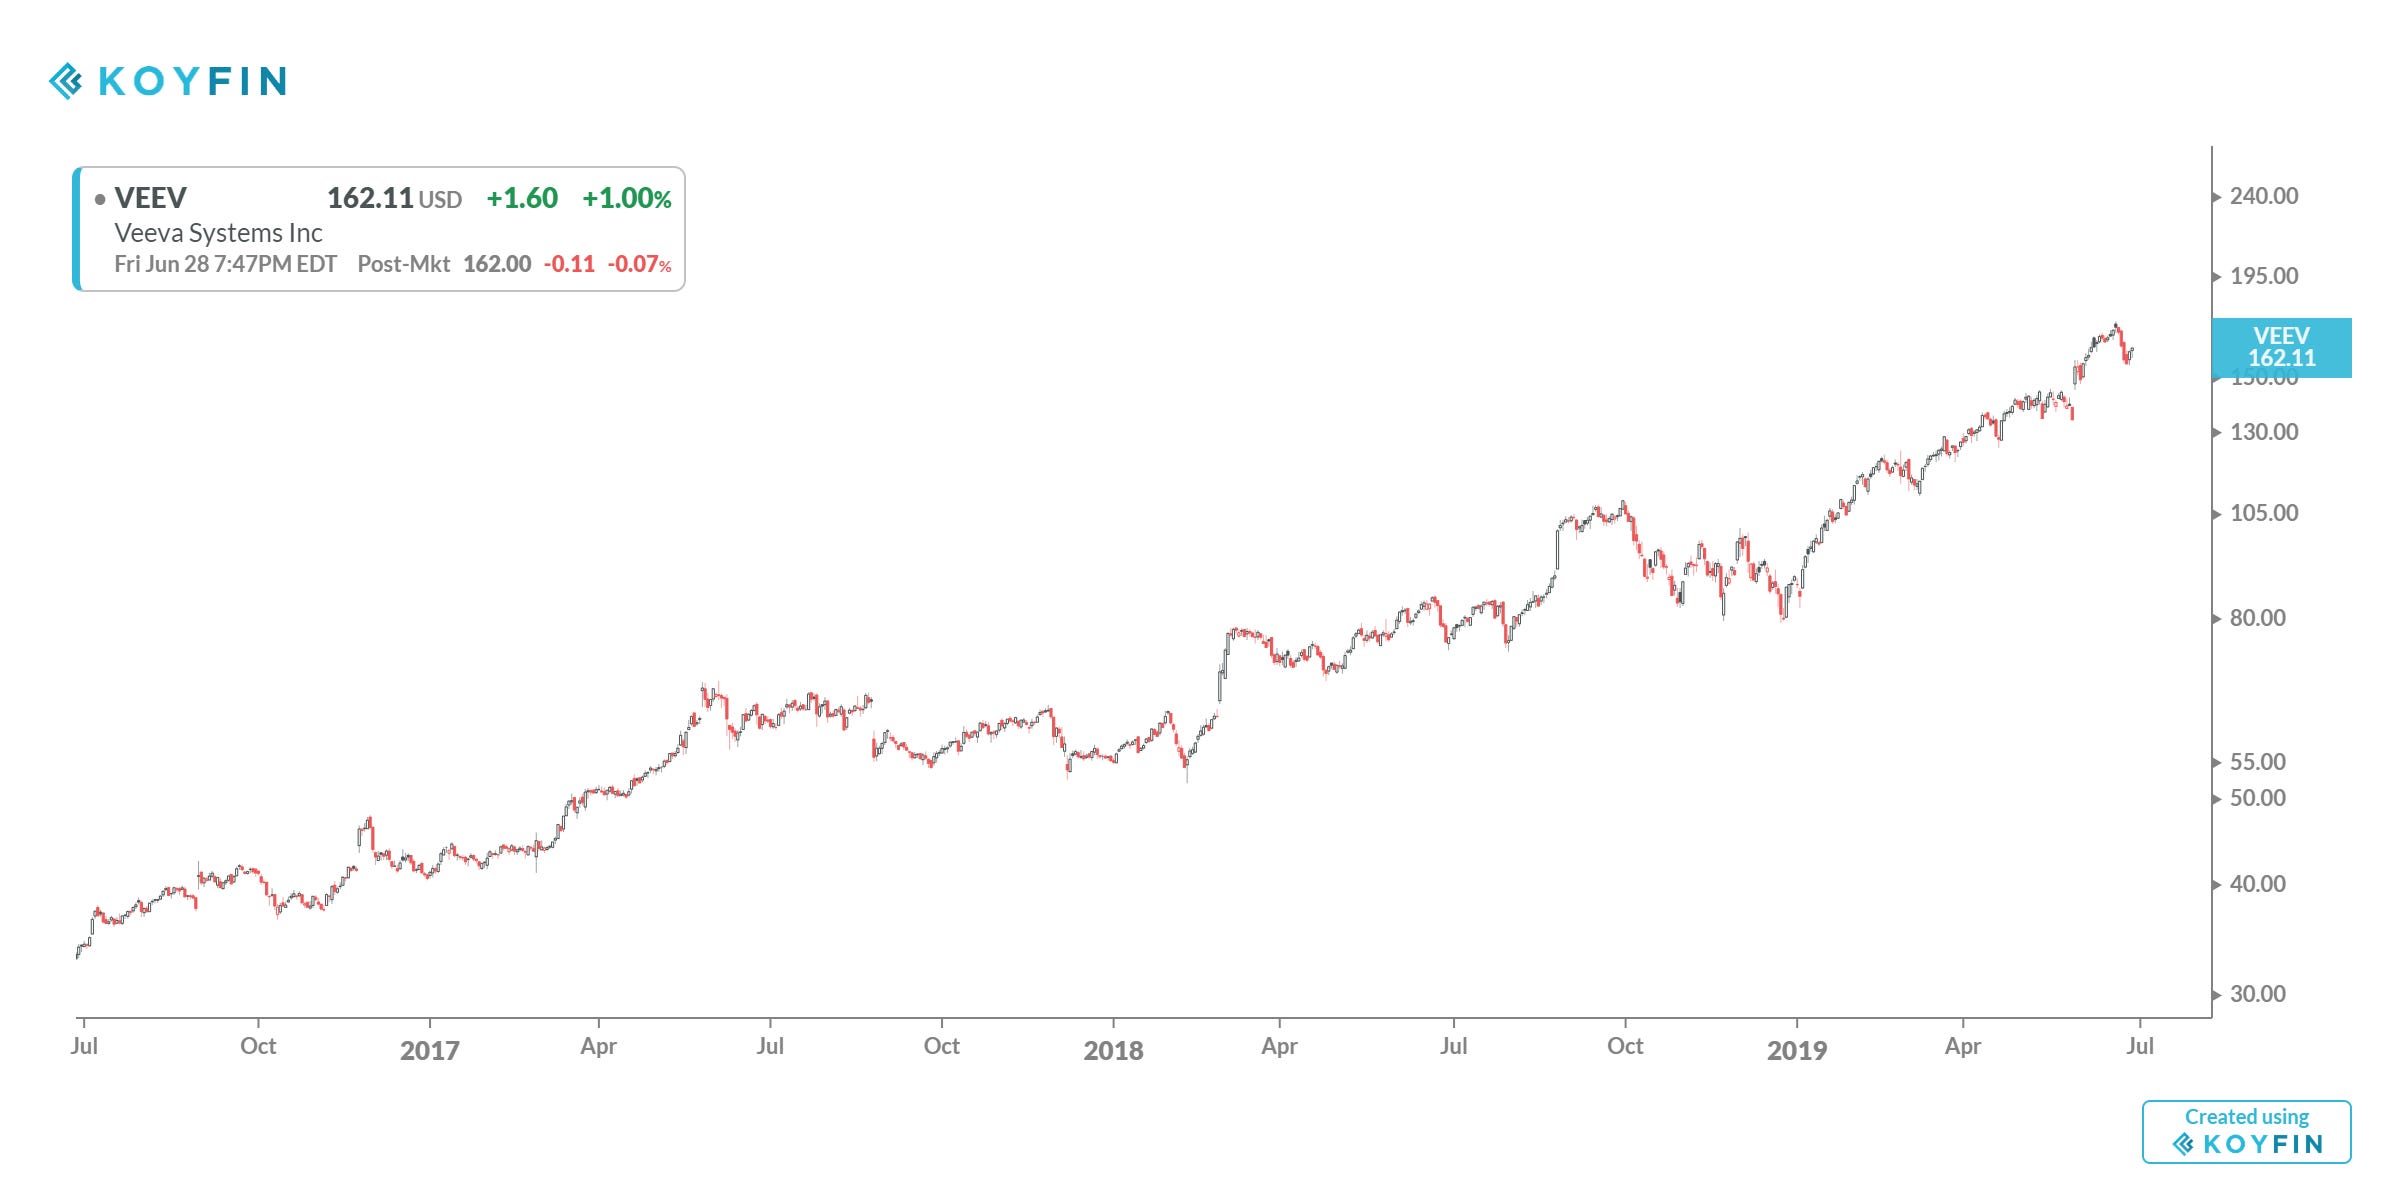
You might ask about why we put them on a list and interrupted our list in Q4 2018? Even with the longer weekly price averages and multi-week time frames focused on, we can get “kicked out” of trends which could be running for months if not years. Charts like TSS and VEEV are typical examples of great ideas we likely captured with our signals and filters from time to time. It’s conceivable if we used monthly (!) price bars and averages, we might be able to capture some long, strong and boring trends. Day traders will be dismayed by this but they have their unique crosses to bear too.
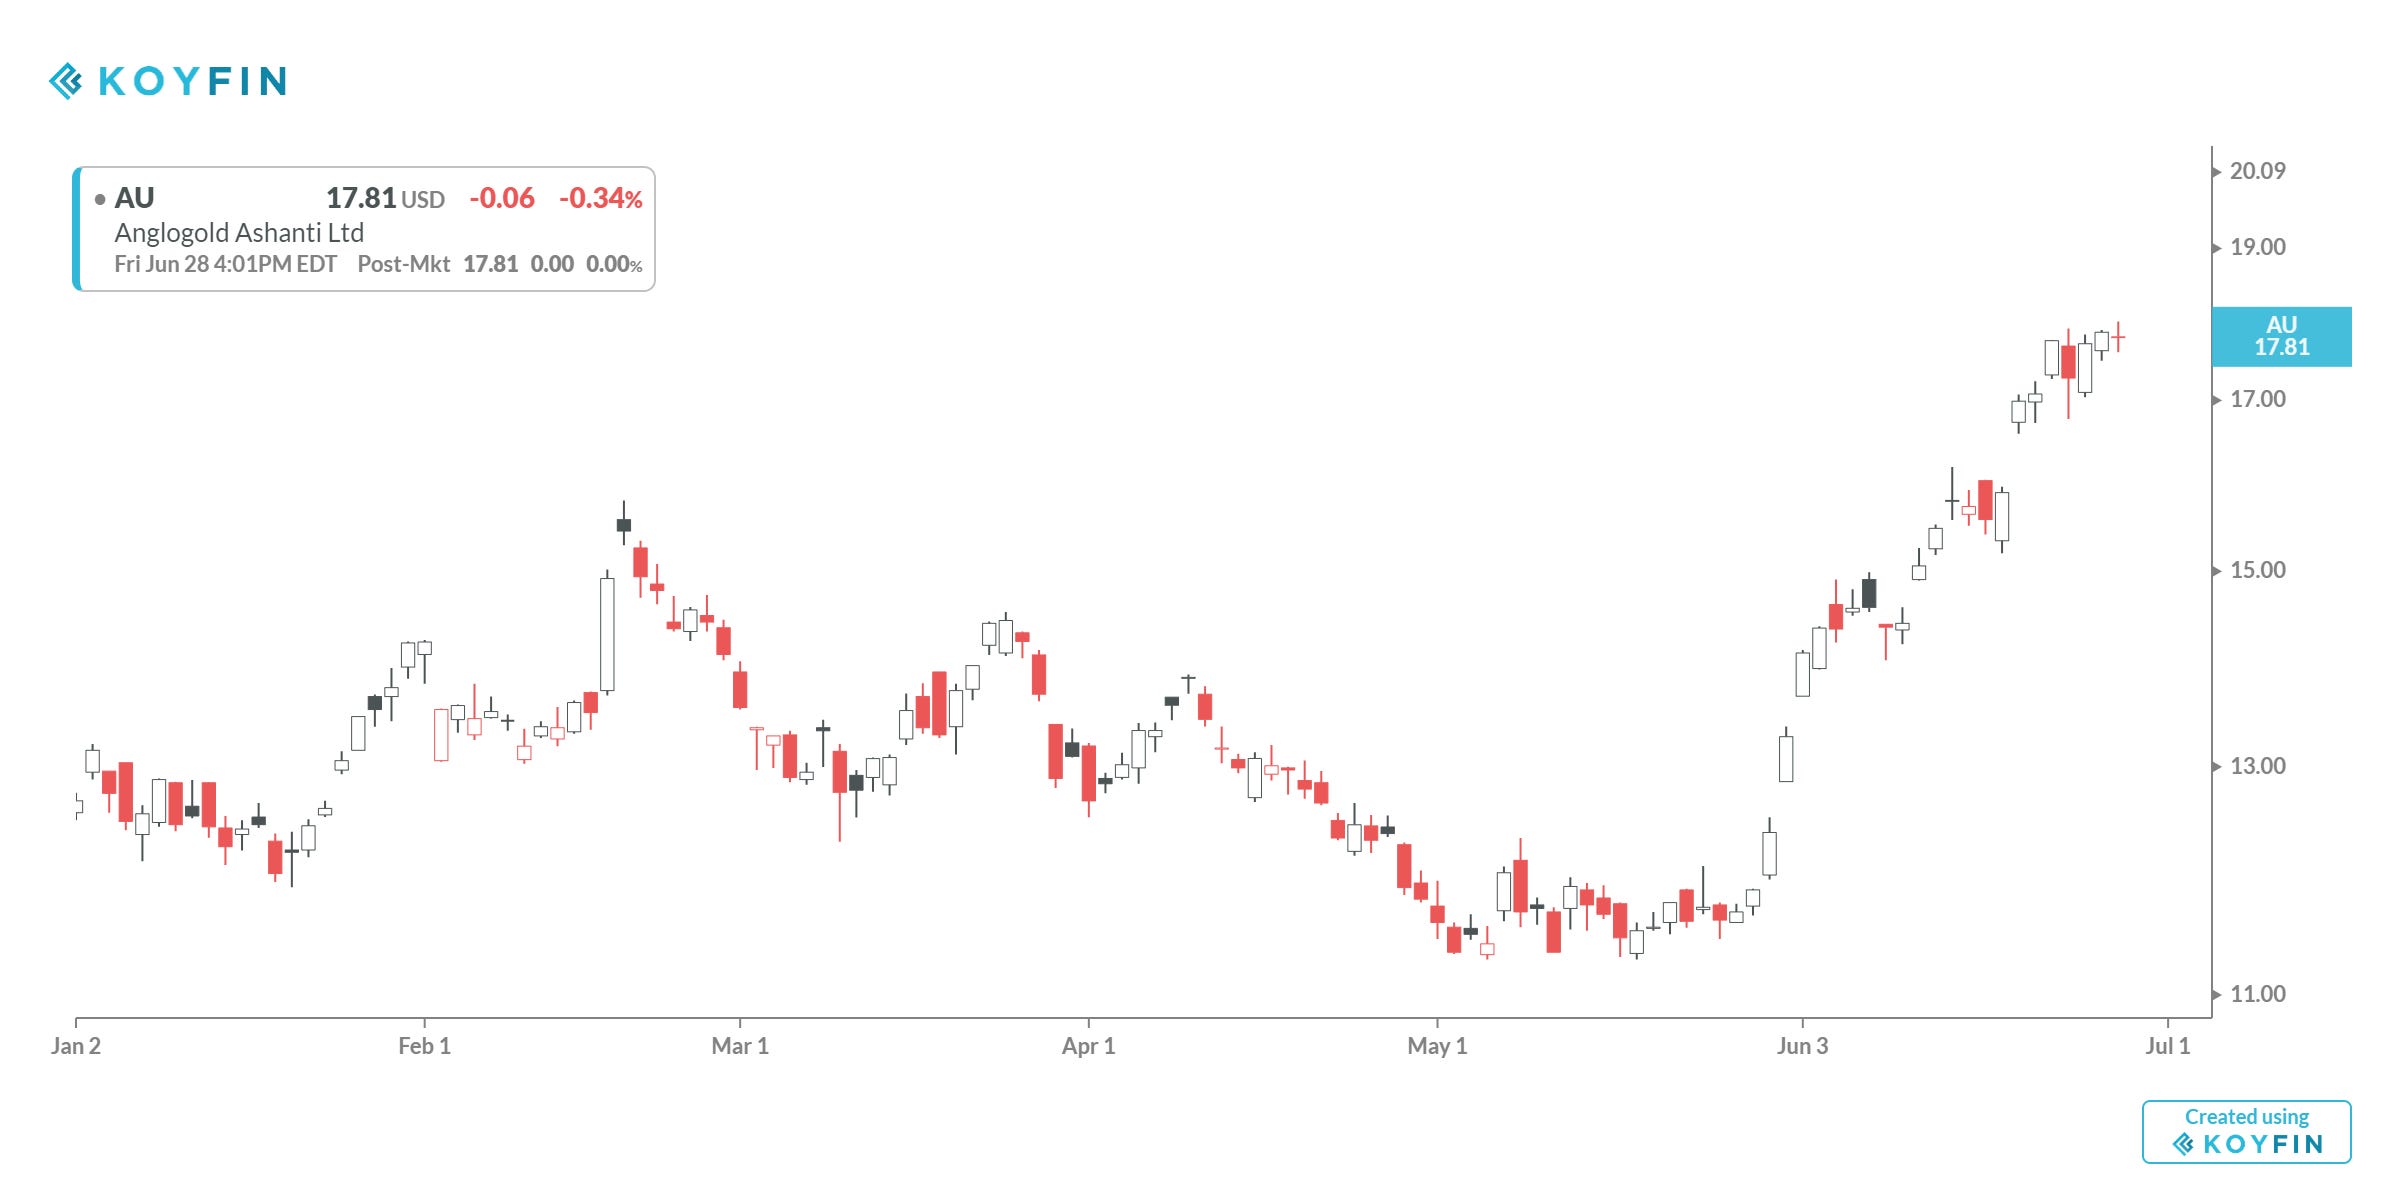
Anglogold was a surprise. Gold is “back” for now. As we see it’s hot YTD but taking a step back, we can see this has fallen from greater prices. Gold bugs rejoice.

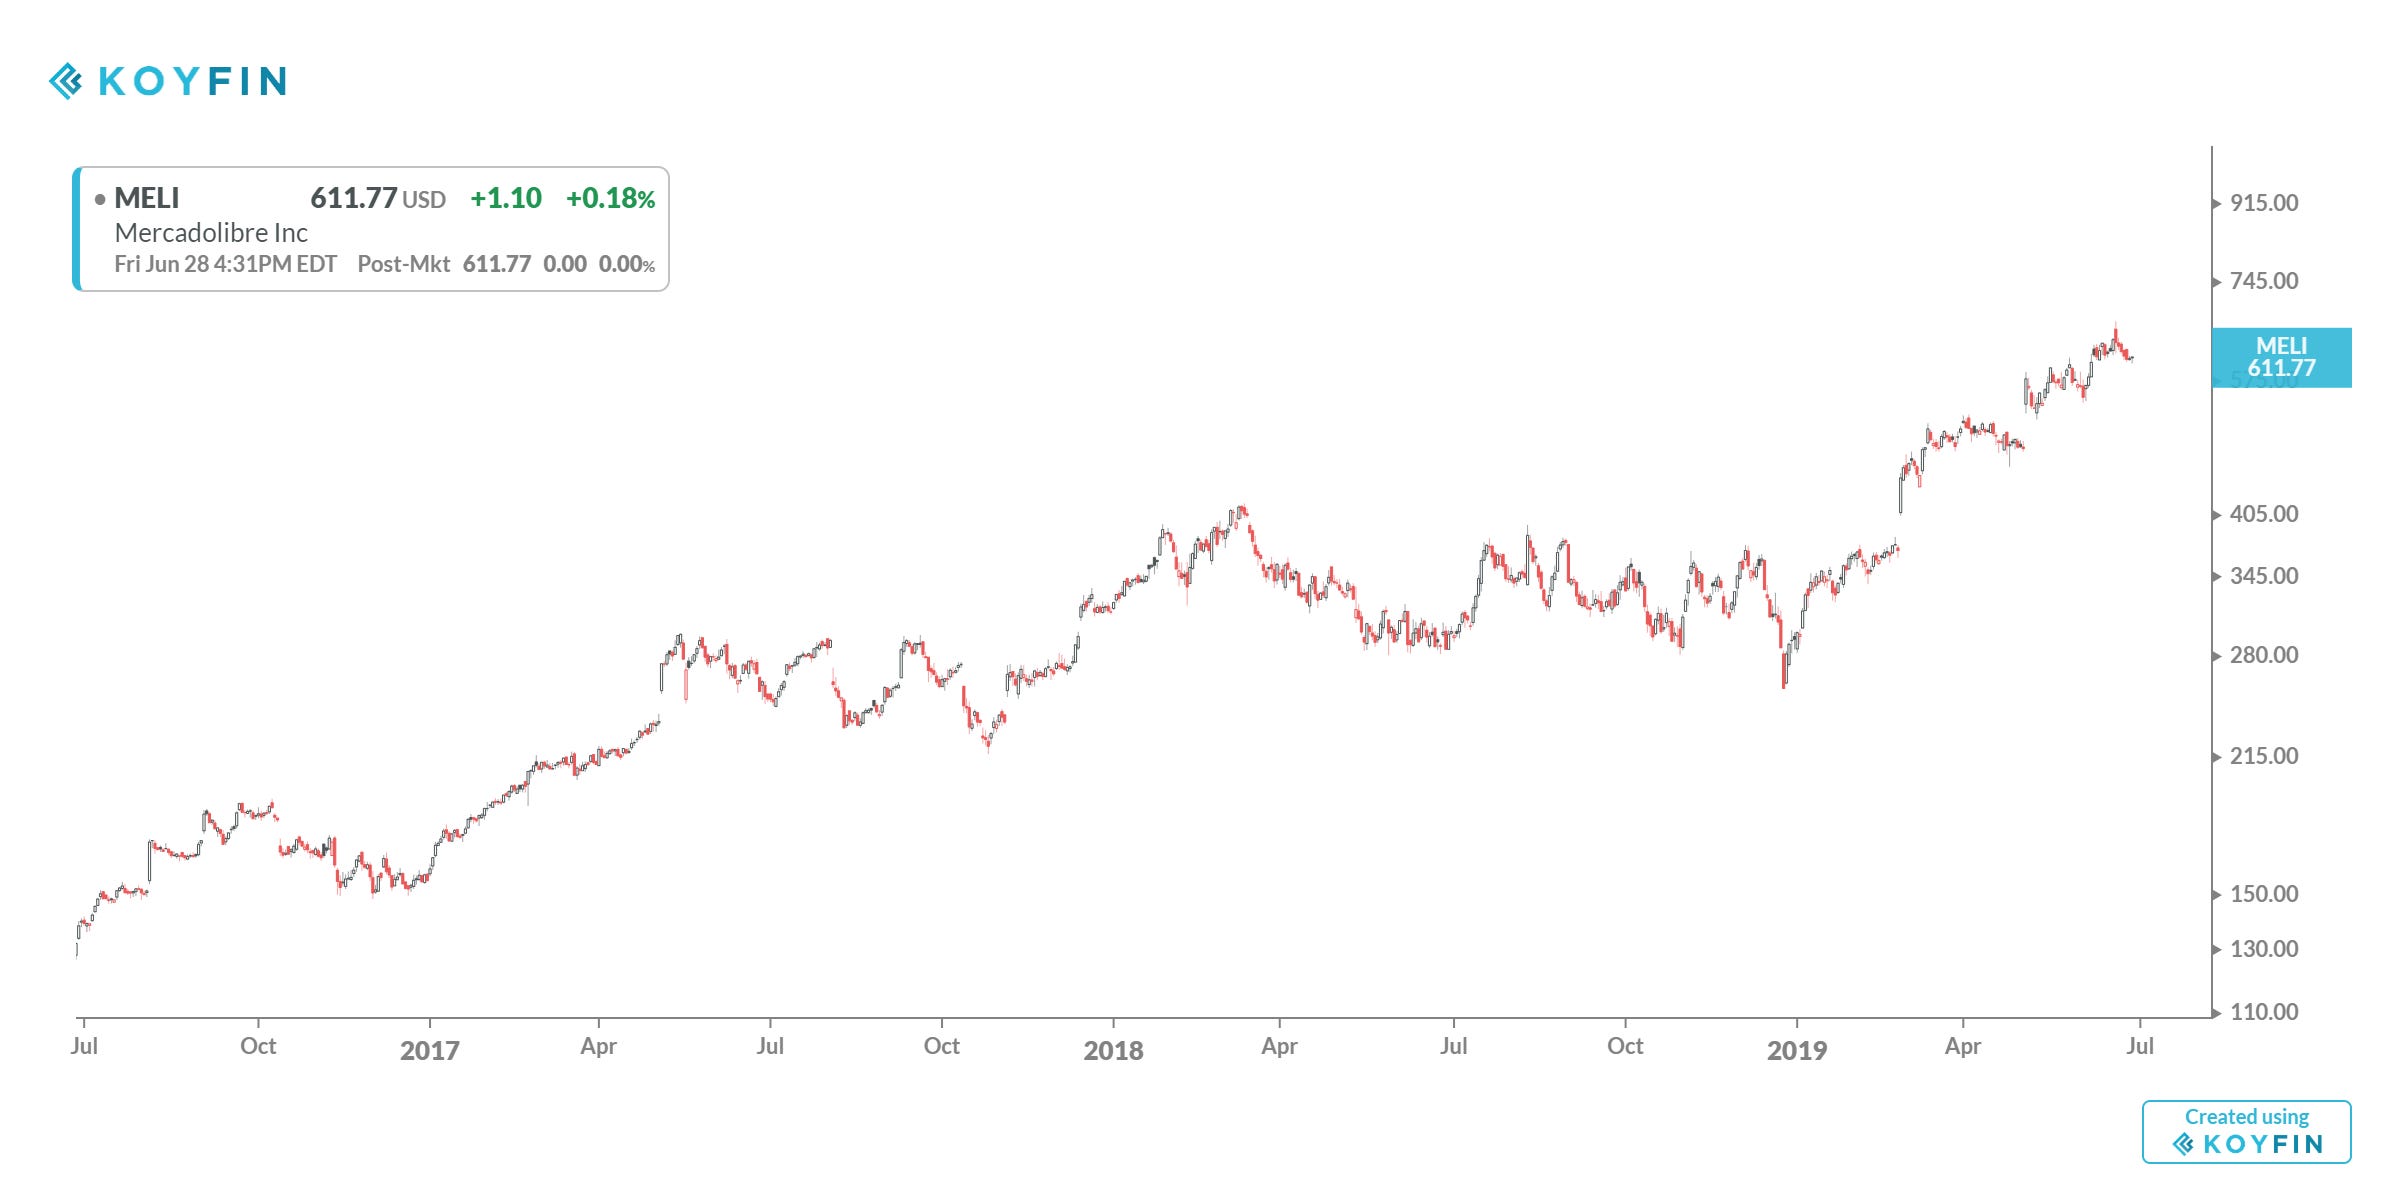
Another great idea, in terms of both price and secular trends could be in MELI, for a LatAm Internet Commerce play. Again, it seemed “late” in March 2019 but here we are still running on a week to week basis - the daily gyration is not my focus.

See what I mean when we take a step back and look at the last few years?
Let’s move on to a few SELL charts and then look at charts of potential “new” ideas.
Mallinckrodt MNK on a YTD and 3 year basis. As a “sell” trend the same principle applies - we just can’t call real “bottoms” any better than tops. We have to wait for it.

See what I mean with this 3 year view of MNK? It's a knife catchers nightmare.

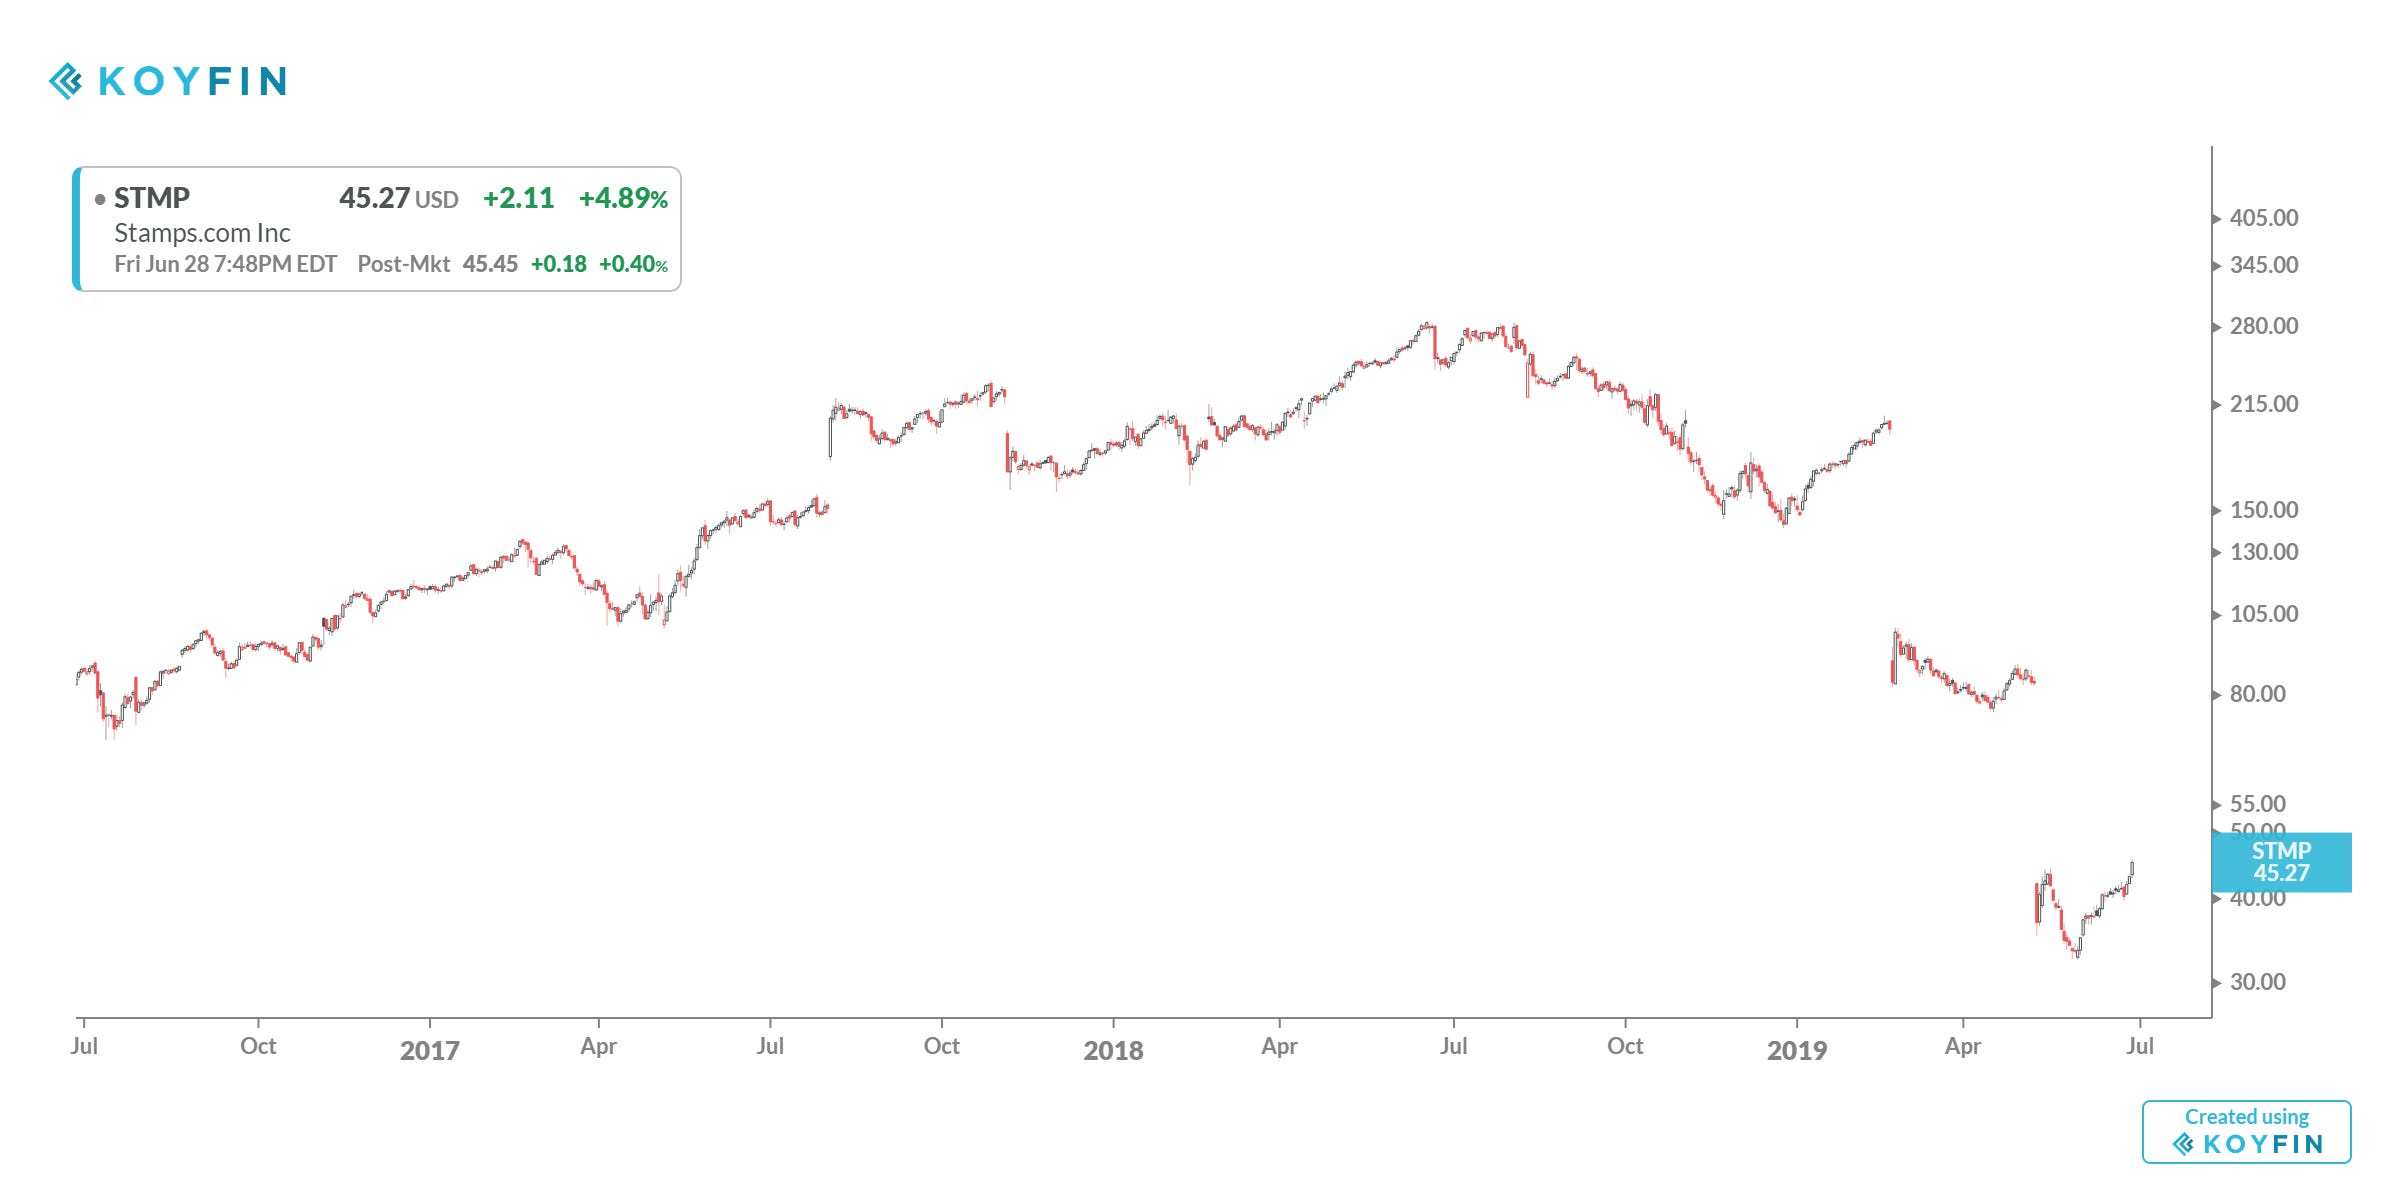
The formerly mighty Stamps STMP

It seemed ready for 300 and beyond last year but that was all she wrote. I wouldn’t trade it, short it, or buy it. I don’t know if there are unimpaired assets for a distressed / value investor to consider and there are better ways for active speculators focused on trends to play.
I will volunteer one pro-active bottom fishing thought - but more as a spectator for now - about the Top 20 SELL list. The energy plays may in fact find a bottom. Why do I say that? If you read last week’s update, you may see a stopped out idea which was the energy ETF, XLE, and that is potential "market tell” that the market’s trend for this sector may be changing. This does NOT mean buy the energy plays but to build lists and watch for potential new signals perhaps by my experience in Q4 2019.
It’s now time to do another set of charts. Potential near-future leaders or at least ideas for your notes. They will be presented very simply and without too much detail - I don’t want to cloud your thinking from your POV or filters.
The following charts are well known but on the Rooster360 ideas list they are relative underperformers compared to the Top 20 leaderboard.


There are a lot more charts like this quick sample which hints at a broader trend.
Here’s a list of 10 LONG ideas, added to the ideas list 2 months ago, for you to consider. The ticker, the time of entry, the simple return since then, the $RISK per share and suggested stop loss exit price to protect your downside in these long ideas.
(note: say the $RISK/share is $5.00 and you could afford to lose $100, then you would trade $100/$5 = 20 shares. Some of you might sneer with disdain at this simplified approach but ask yourself, what are you doing in your system? Do you plan your trades ahead of time? Do you know what your Risk is?
Never mind the chestnut of a “5 to 1” reward to risk or some other rule of thumb for trade selection. In trend following, the most important part is your “cost of business”, the risks you have budgeted to accept against your capital. I had one follower dismiss an answer I gave on some idea because I didn’t have some very specific business model-relevant answer he apparently didn’t have yet, which might have satisfied some emotional void connected to a position it was clear the follower held - and clearly held very tightly and in “size” - but was in need of further confirmation. The upside takes care of itself for the best and most persistently successful methods are lumpy and therefore painful and unavoidable in terms of losses.)
Anyway. Presented below a list, tied to April 2019, of potential ideas for you. The reason I share this subset? They haven’t taken off as of yet and there is nothing to suggest that they can’t do that - these might prove to run and so give them a look.


Another list of 10 Long ideas, which were added in May 2019, to consider for H2 2019.


Plenty of charts with suggested “risk per share” figures for your notes, filtered down from a few hundred potential ideas.
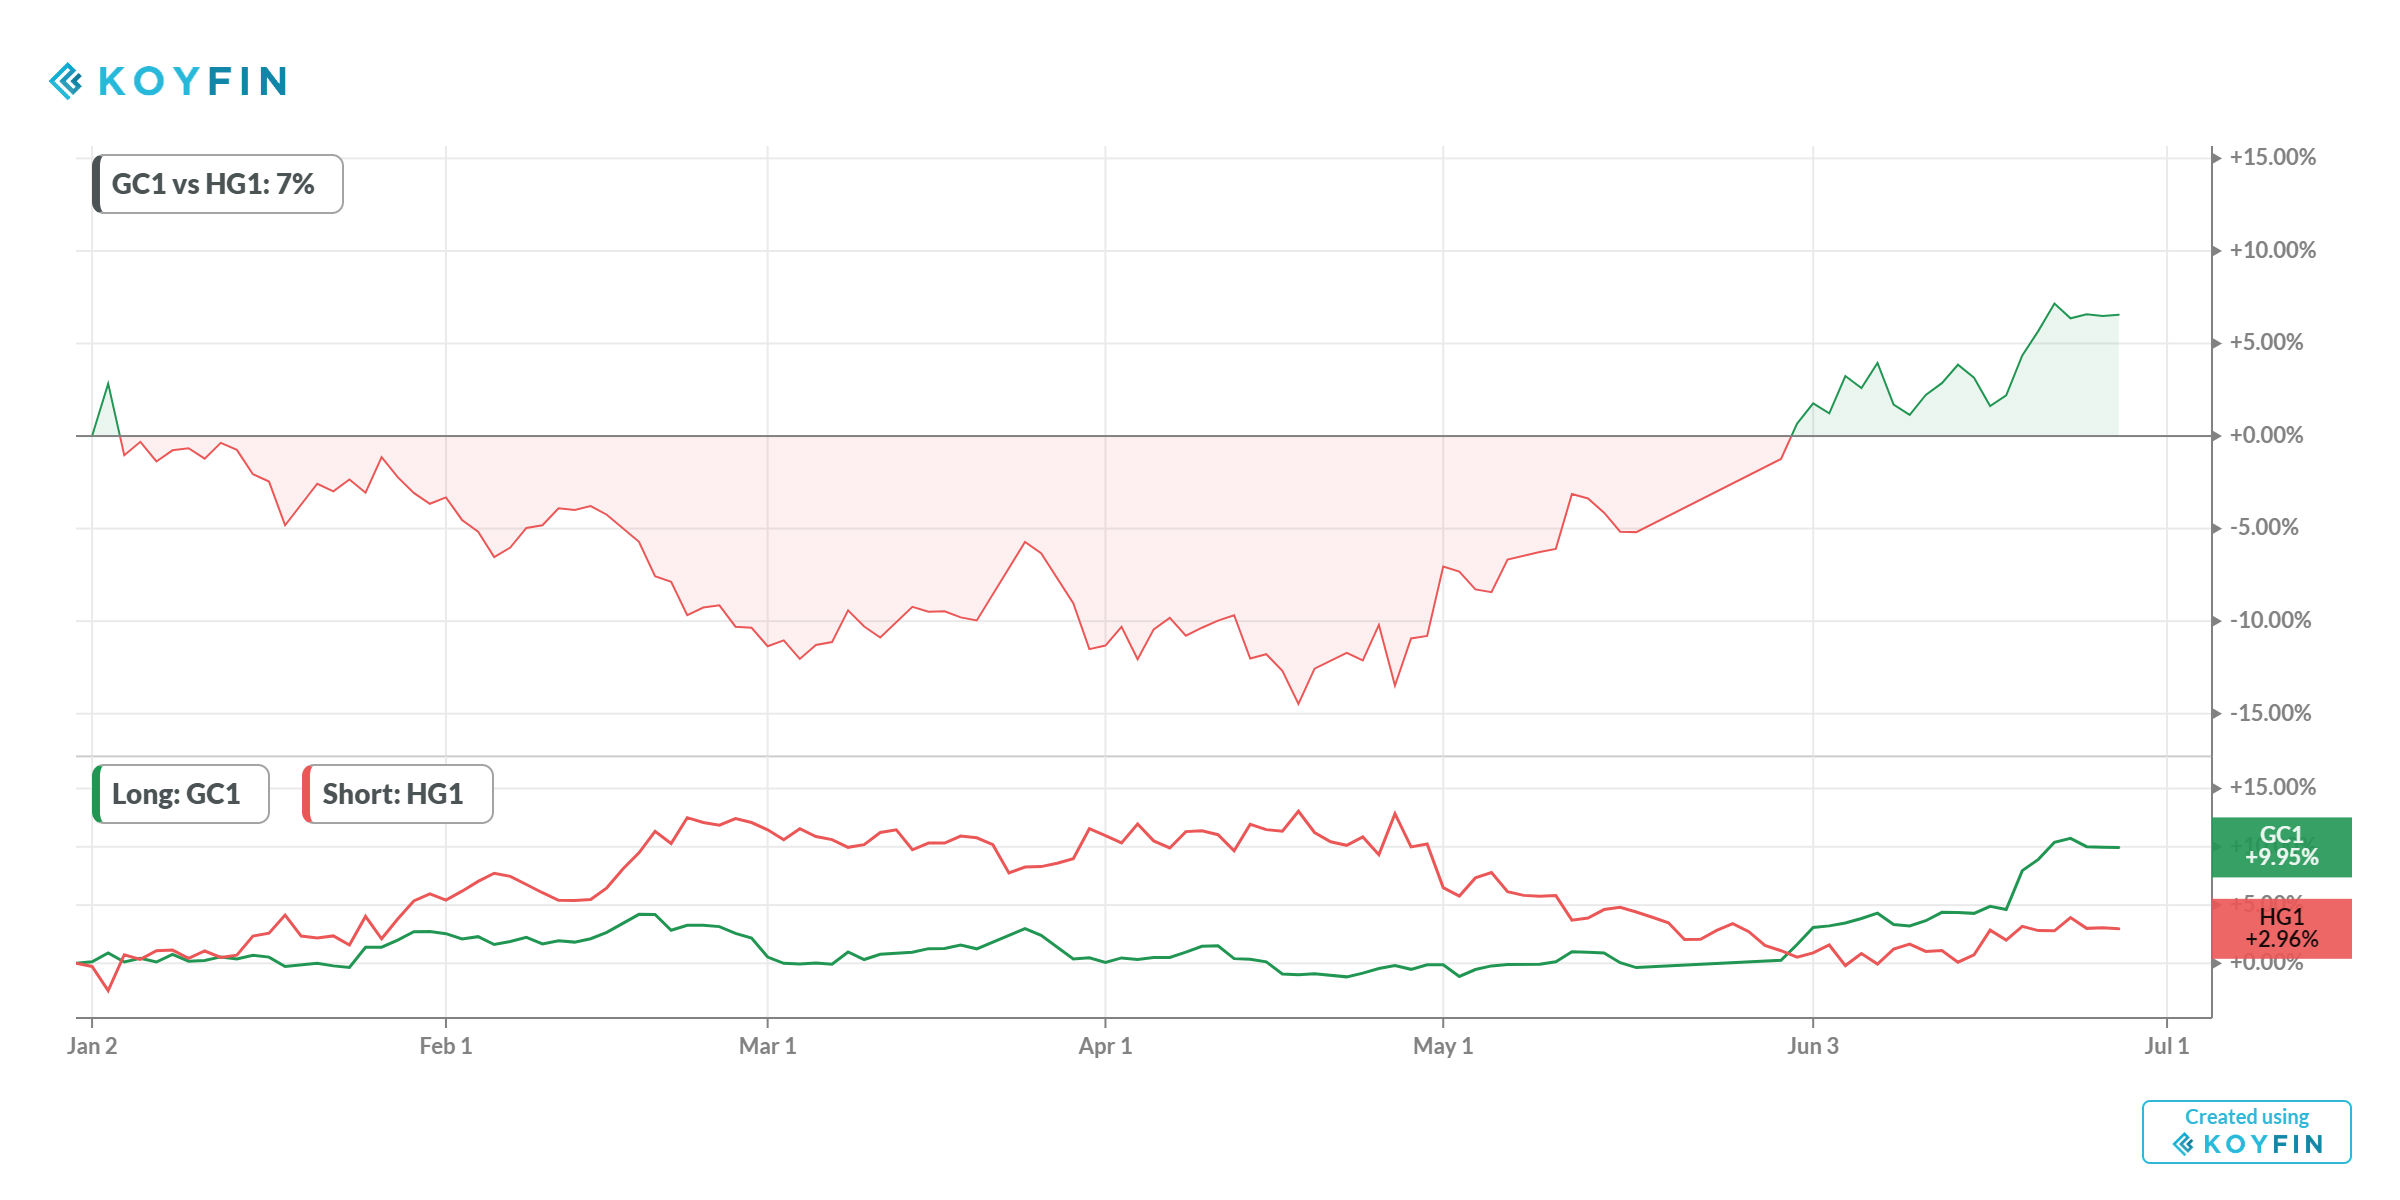
On to the big picture, top down views of futures charts.
Gold versus Copper over the last 6 months.
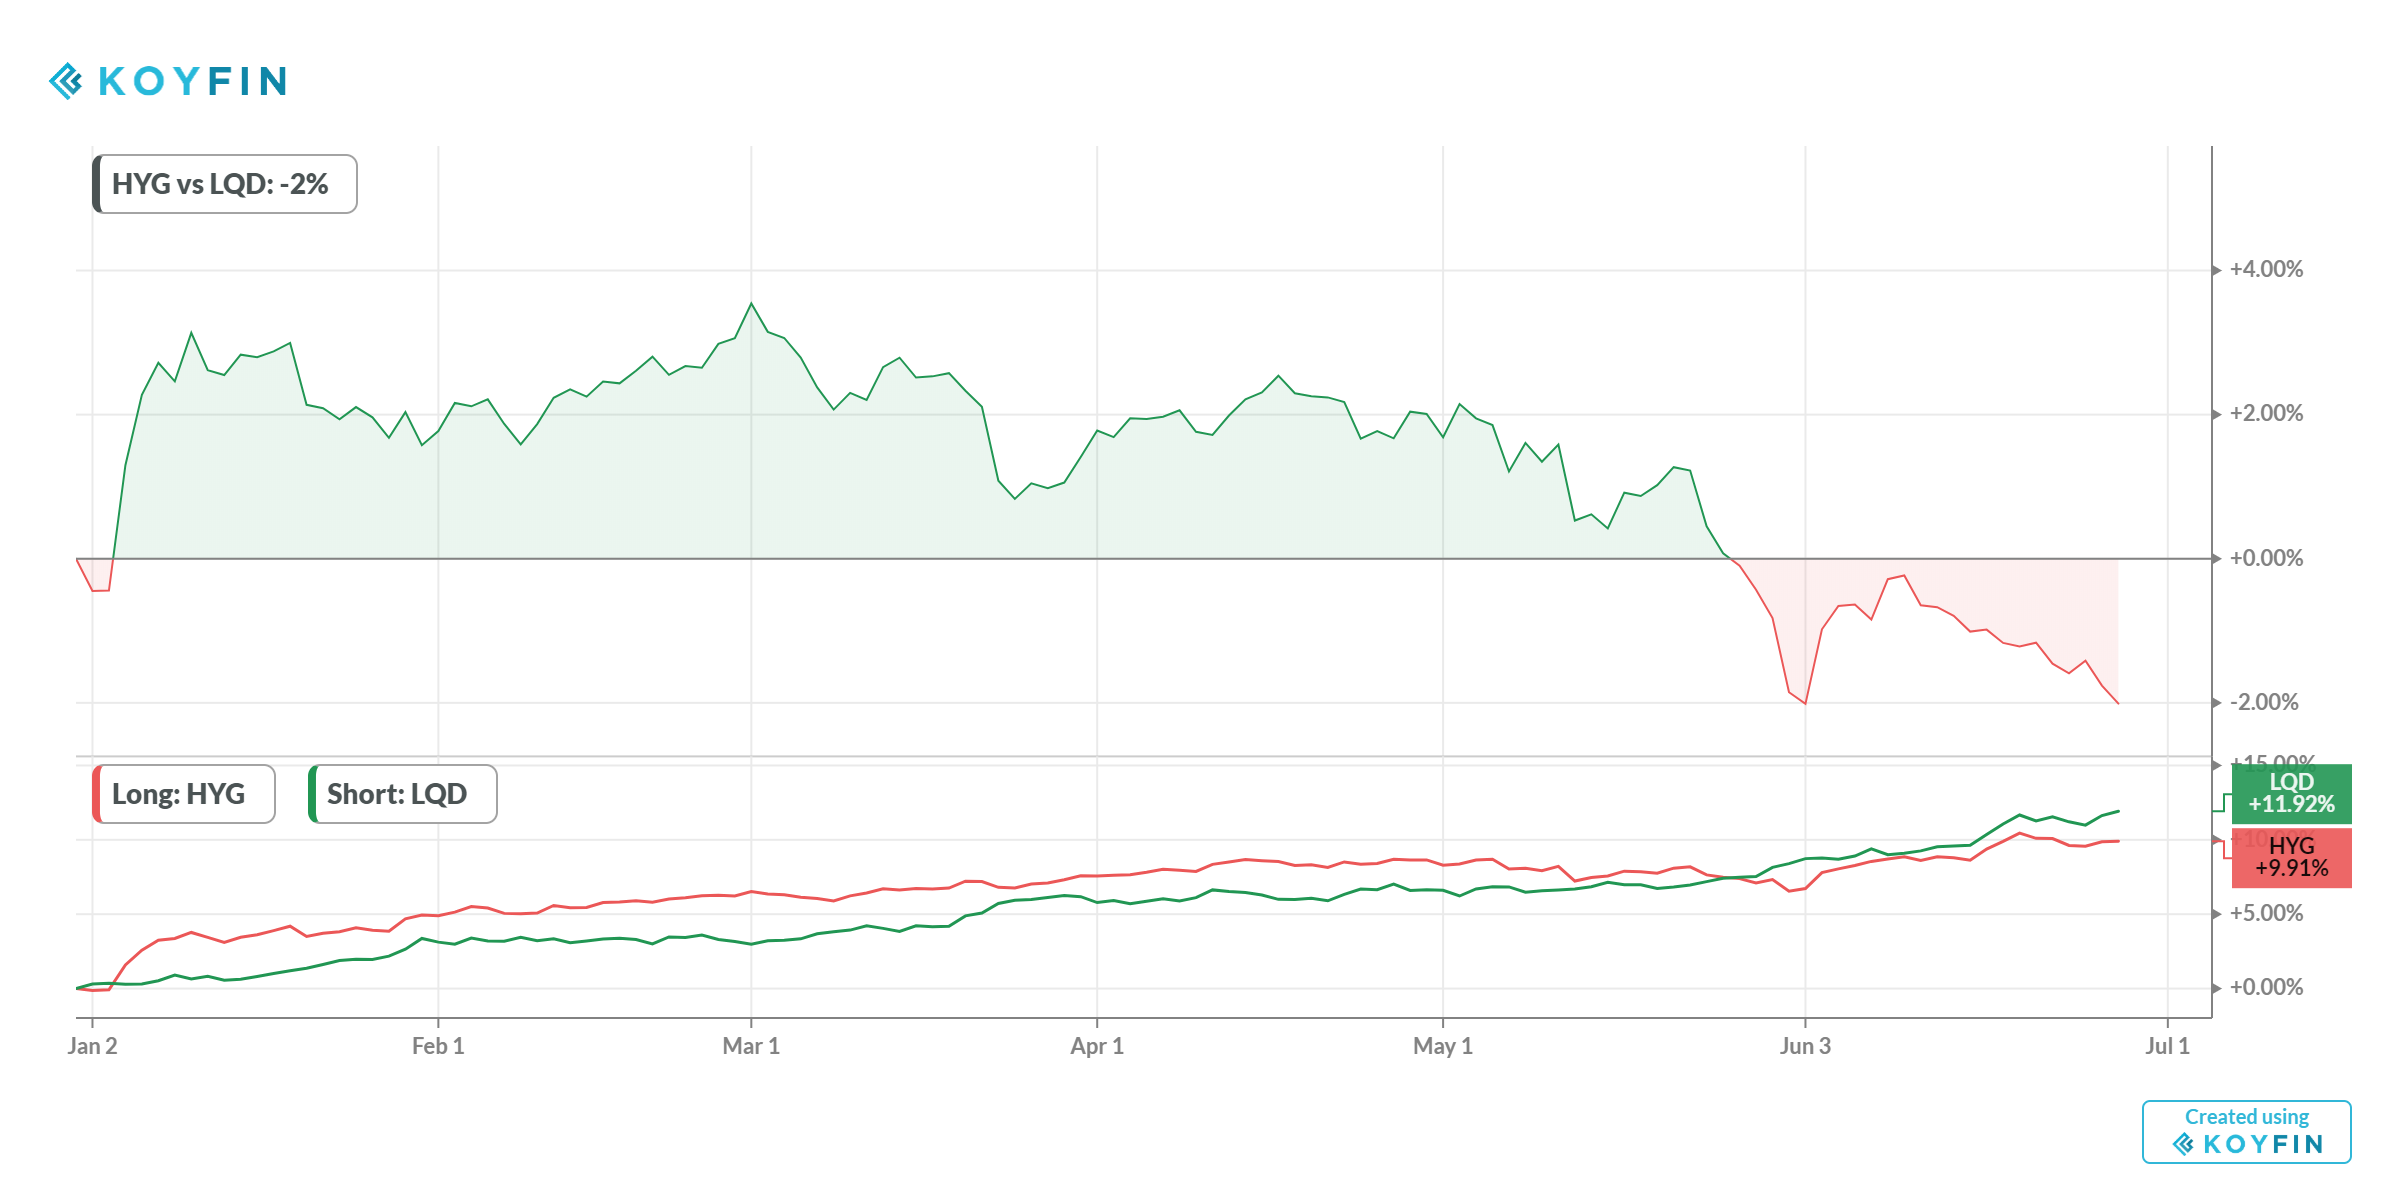
High Yield vs Investment Grade
ICE Swap Rates, Based on USD, 10 Year

Crude Oil Brent

Euro pausing its decline, for the moment. Let’s watch for a potential USD decline.

The BUND and the DAX. Germany, engine of Europe via stocks & bonds.


The 30 Year and 10 Year UST. (BTW don’t fret about China and Japan owning about 5+% of the debt each, or about 1.1T USD or so. “We” “own” the rest and the big kahuna includes the Federal Government via trust funds associated with various social safety nets with a $5+T position. That’s a talk for another time.)


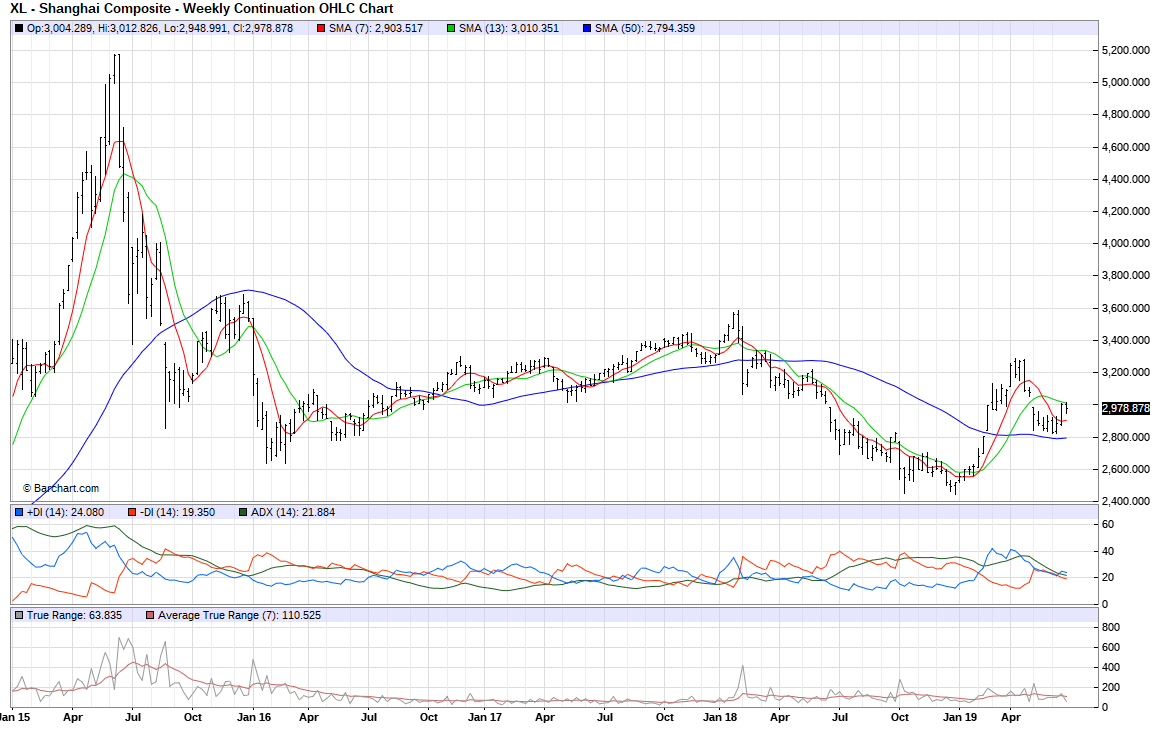
Shanghai, Shenzhen and Nikkei


The Eurodollar chart.

U.S. Equities Indices
The Russell is one to watch. If it does breakout and establish a new uptrend and highs then we may be off to the races. The other indices are closer to new highs.


An interesting second half is coming but I’m watching for which groups lead next.