


Slow Climb To Highs and Q4 2019
A Summer Swoon In The Rear-view Mirror, Cautious Preparation Follows

This market never fails to surprise, After the market’s recovery in the first and second quarter from the massive H2 2018 decline, the sell-off and bounce in the third quarter, could we be ready for new highs in the final three months of the year? I just don’t know. The broader numbers don’t say recession but there are so many signs that not everything is quite right. I look to the trailing 12 months coverage of the IPO market, and the alleged rotation into new groups away from higher growth companies which had led for so long. Let’s go to the charts, and see if we can make sense of how it will be for trend-followers and active speculators/investors.
First things first. What ideas got stopped out. In terms of profitable ideas, Shopify (SHOP) finally has been taken out. What a ride. And in sell/avoid ideas RRC and WLL had enough of a bounce to be stopped out.
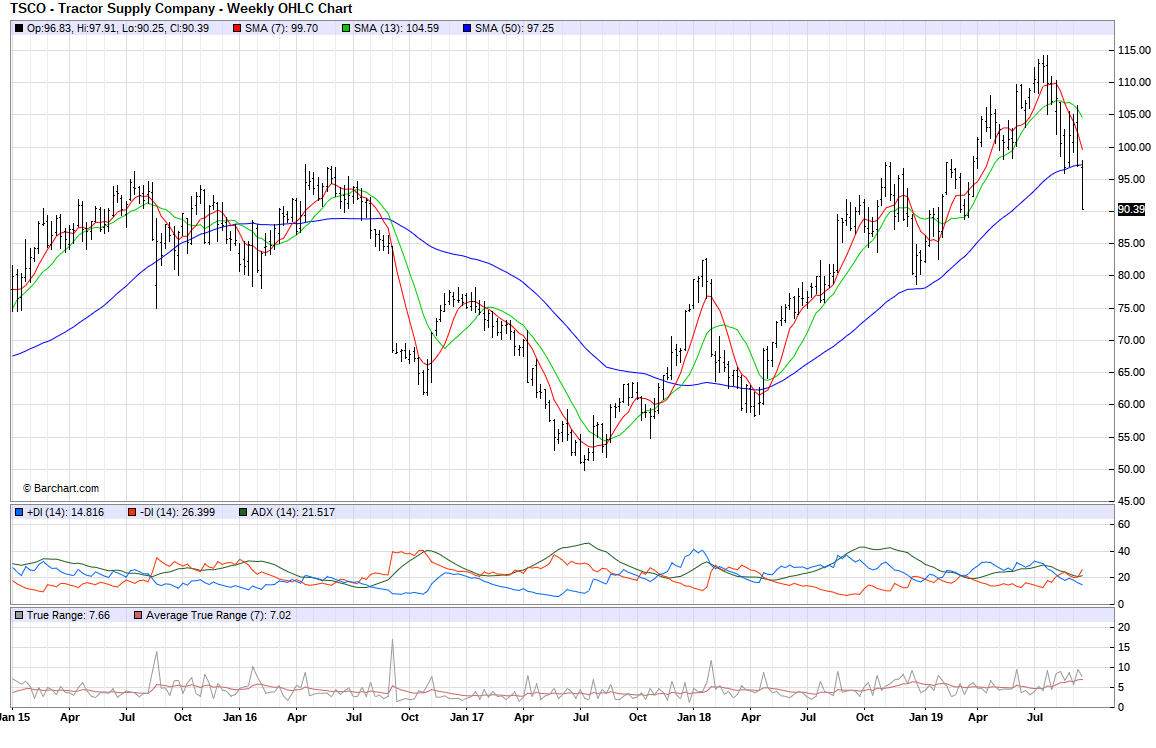
I want to use long time frame charts to give us perspective. Sometimes, even with the focus on weekly prices, medium and long time frame averages and trading ranges, it still seems too close up. At this point, no question with my limited set of criteria, it’s a long exit.

Range Resources may be stopped out but as we see it might be a pause before more.

Same with Whiting Petroleum. There was a “stop” on the sell but more could follow.

A few more ideas which got stopped out and then we’ll move on to the Top 20 lists.

And now for the Top 20 LONGS list. There’s a Koyfin Charts list for your notes free.
And there’s also a Top 20 SELLS list, also with its own Koyfin Top 20 SELL list too.
The TOP 5 LONGS charts that did the best over a trailing 3 month time frame.


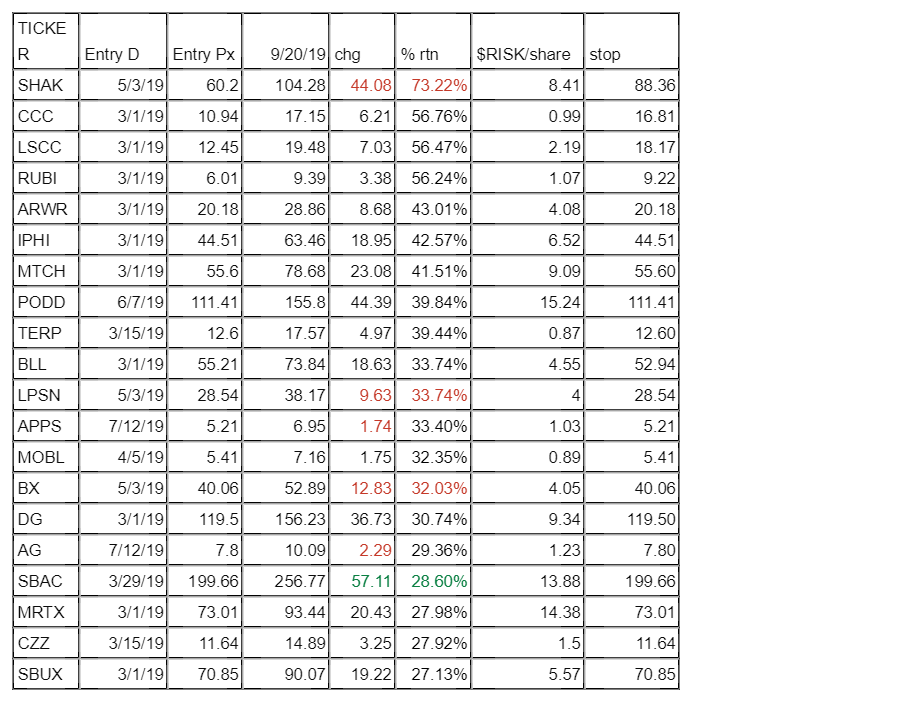
Here’s the Top 20 LONG LIST which has the current leaders and updated risk notes.
And there’s also a Top 20 SELL spreadsheet of current leaders and updated risk notes.

The probation list for LONG ideas which may or may not survive through Q4 2019.

But many readers and newer traders want to know what to do, what they “should do”, “will it go up?”, “will it recover?”, “what made this happen?”, etc. The truth is nobody has a solid lock on these answers but there are in fact different ways and answers. The real secret sauce is having a system with some edge and your ability to have consistency and comfort being in your own skin in how you handle these choices. The edge is here is to do mostly the opposite of everyone else: longer time frames and avoid the short-term traders’ collective influences, focusing on trade size, on risk to the entire portfolio and/or total savings, on matching trades with one’s circumstances and intentions, and taking the time continuously to update those intentions. I tend to focus on tight control of small trading sizes combined with time frames, or very very long time frames which border on buy & hold (if it’s working and if it’s a sound enterprise, so “hobby”/”trendy” doesn’t work at the really long time frame end of this).
Case in point. Here is one very unusual example for a trend-following site. Apple.

This is now a very mature and old business in terms of smartphones. BUT it has a deep bench of assets and engineers. On the price action and technical price view, it was a dog last year - for MOST time frames. Then it was at the 200 WEEK SMA. The balance sheet said “no worries”. The product lineup and history of how that evolved from disappointment to dramatic growth pointed to revenue that would come from new product and service lines. The time frame required: extremely long and patient. And so This was a “buy” after Christmas 2018, with the understanding, the real results would not be apparent for at least 18+ months afterwards. I use 18 months as my default time frame between extremes - assuming the idea is not a fraudulent, false or operating financial disaster. The point of talking about Apple is to stress we can focus on price action close up or we can focus on price action over long time frames.
Now what ideas could benefit from this approach?
That’s why I start almost every weekly update with what ideas have been stopped out.
Today’s hero becomes tomorrow’s “heel”. My favorite shorthand is “paragons into pariahs”. We call this a contrarian view and for me this comes in when we see a trend “turn”, reverse, or “fail” (there is no real failure, just new information, that’s why I use quotation marks on the word FAIL). The SELL idea which gets stopped out could be doing well 18+ months from now. The LAGGARDS which are not leading but NOT getting stopped out, may be in the middle of an 18+ month journey to leadership.
Okay, let’s go back to charts and look for some of these types of potential leaders.
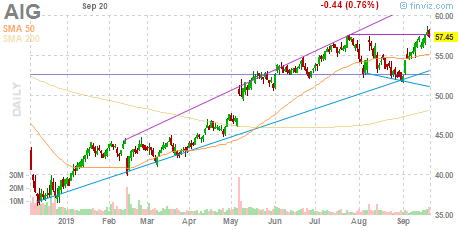
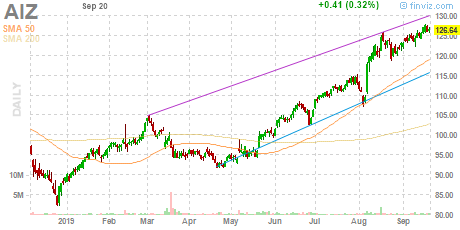
Here are 20 LONG charts for your notes to review and run through your filters.


Let’s close with some big views, a look at futures charts.
We begin with the big chart story of crude oil, not sure if that’s sustainable.


The broader view is that we are not in dire straits. And it’s the same story as before, there’s always a reason to panic. So don’t panic, make plans instead. And if you’re not a day trader or a nano-trading bot, there is nothing to do except keep an eye on your risk.