


Market Backing Up From Recent Gains
Weekly Q2 2019 Update, Most Recent Week Cuts Into Gains

While there is progress overall for the master ideas coverage universe, this week’s recent price action has cut into notional gains in total. Let’s go over the various parts of the list and review. I am wishing all safe, healthy and happy holidays, and just plain good weekends and time, with family and friends. This week’s update will likely face some substantial updates next weekend - In Q2, price action will resolve itself into a warm-up for either a longer run-up or a “fail” and then sideways action pre-decline.
Last week’s summary view of the master ideas universe is shared again below.

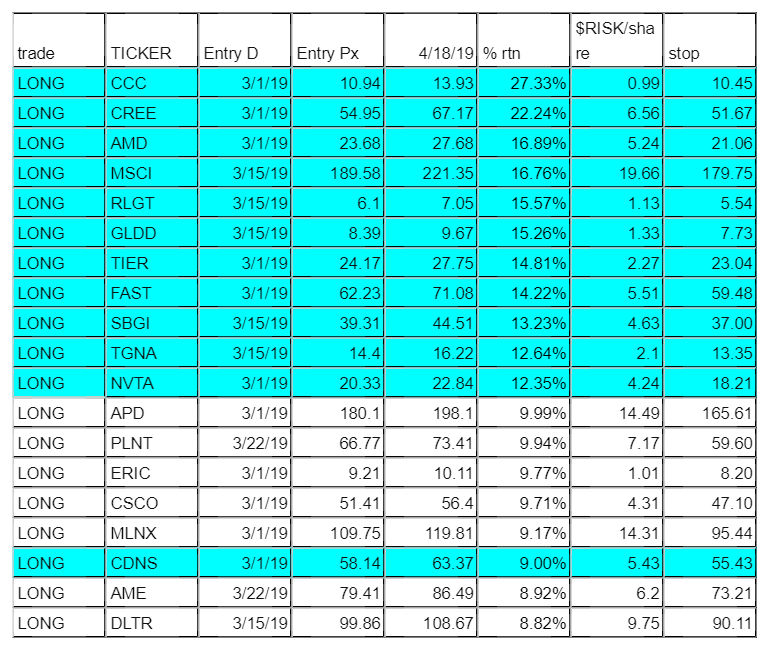
This week’s update of that same summary list shows both an increase in the number of ideas but also a sharp decline in notional total gains. (Notional profit & loss is calculated according to weekly closing prices, from when an idea is added to the list versus most recent weekly closing price. Share sizes are estimated by an estimate of $500 divided by “risk per share”. You’ll see from the charts shared each week how that works - not fancy but it’s a starting point.)
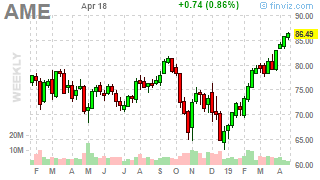
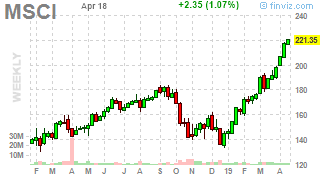
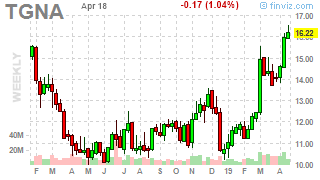
Let’s focus on the “Top 20” lists for trend-following longs and shorts. These are the current leaders as of this week for LONGS and SELLS. First the LONGS and then the weekly stock charts, and then the SELLS and relevant charts.


Not every idea makes it through to profitable glory. Some get stopped out right after leaving the gate. Let’s take a quick look and nod at this reality. Let’s just review a handful of them, the “SELLS” which were stopped out as of this week.


Let’s move on to another cohort of LONGS and SELLS, the “NEXT 20” lists.


And now for the “NEXT 20 SELL” list. These follow the “Top 20” SELLS.


These quick charts for some folks would be more than enough. You have ideas, trends in place which could run for months (and in the past we have been lucky to track ideas which would run for YEARS), with suggested trade sizing. There are well known publications which charge a pretty penny (or these days a “satoshi”) for just that alone.
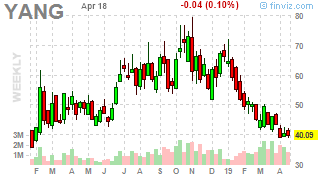
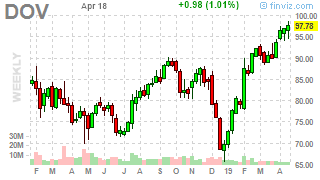
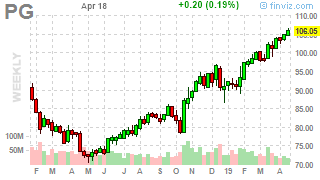
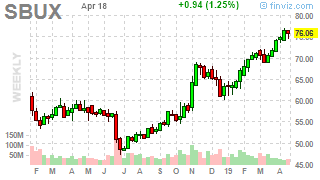
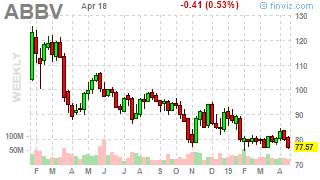
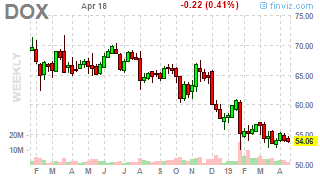
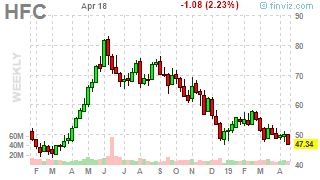
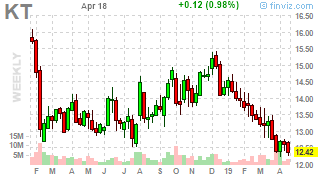
But let’s move to charts from the broader universe of ideas. For the sake of brevity, we’ll just focus on charts from the total universe. At this point, we are now getting to 250 ideas long and 80+ ideas “short”, with prospects of it growing longer.
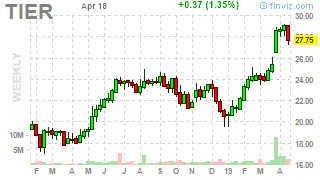
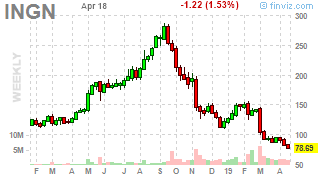
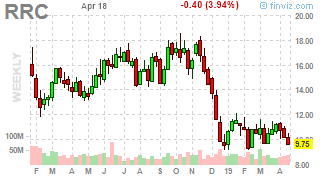
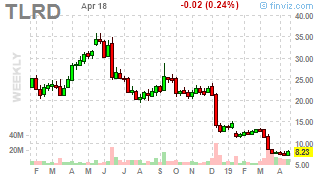
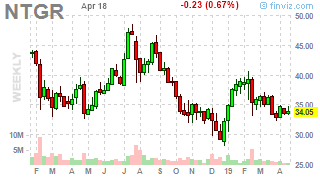
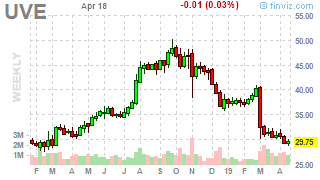
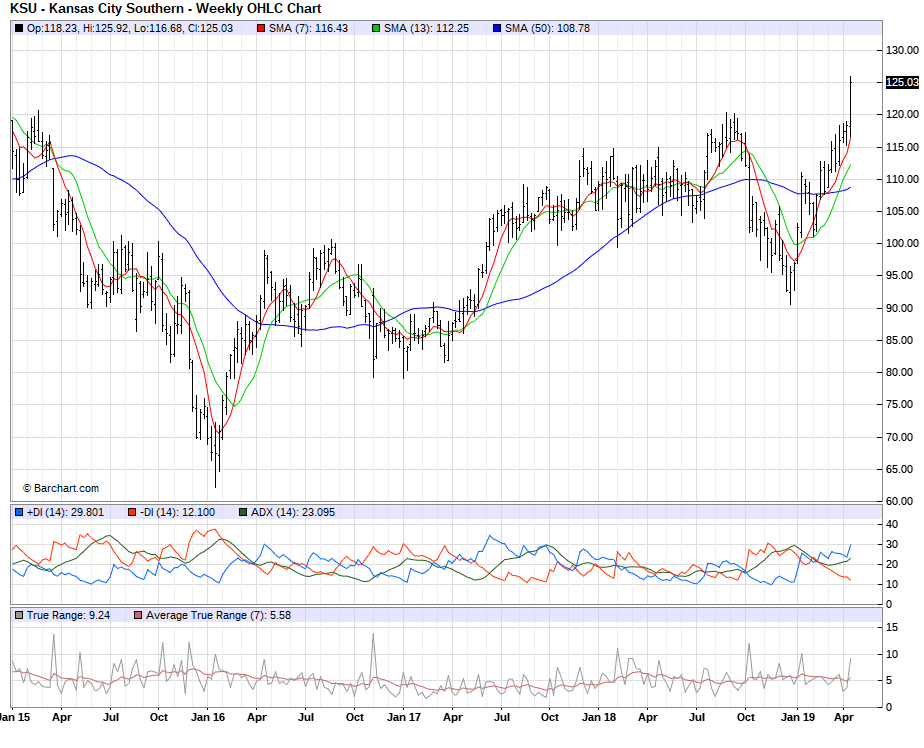
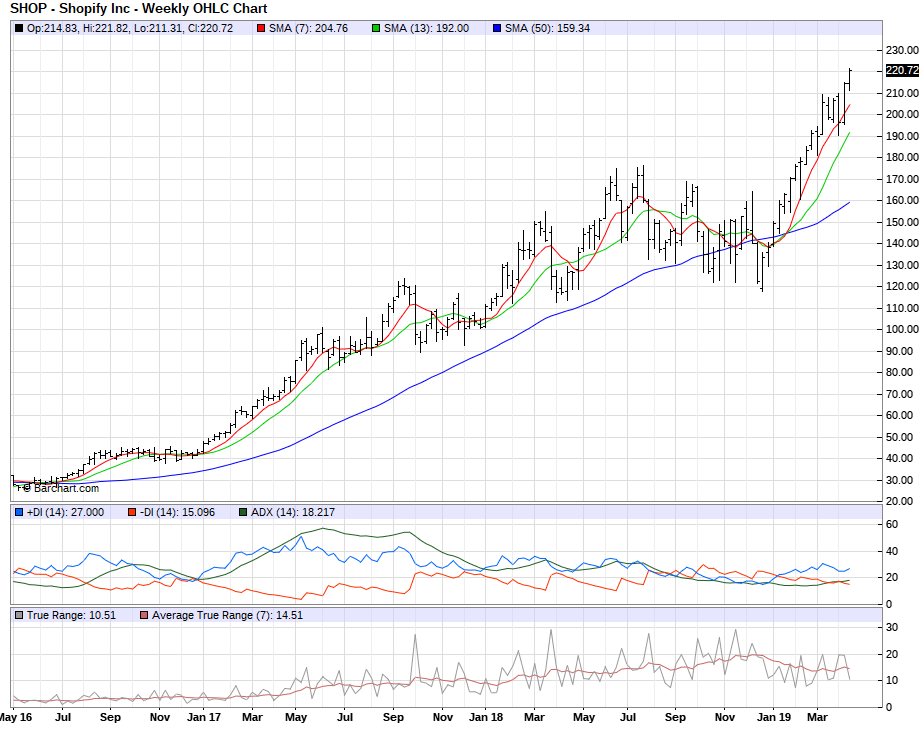
Let’s just look at charts going forward in the post from the broader ideas universe which seem interesting, that should be more than enough to satisfy and feed your speculative imagination, and not blow up the smart device you’re likely using to read these updates. Let’s take a bit more time on the following potentially more “interesting” charts - some are are already noted earlier in this and prior weekly updates but I wanted to see if this might be more helpful than posting the alphabetical lists which seem to grow with each passing week.


Let’s move on to broader top-down views of various markets and futures.


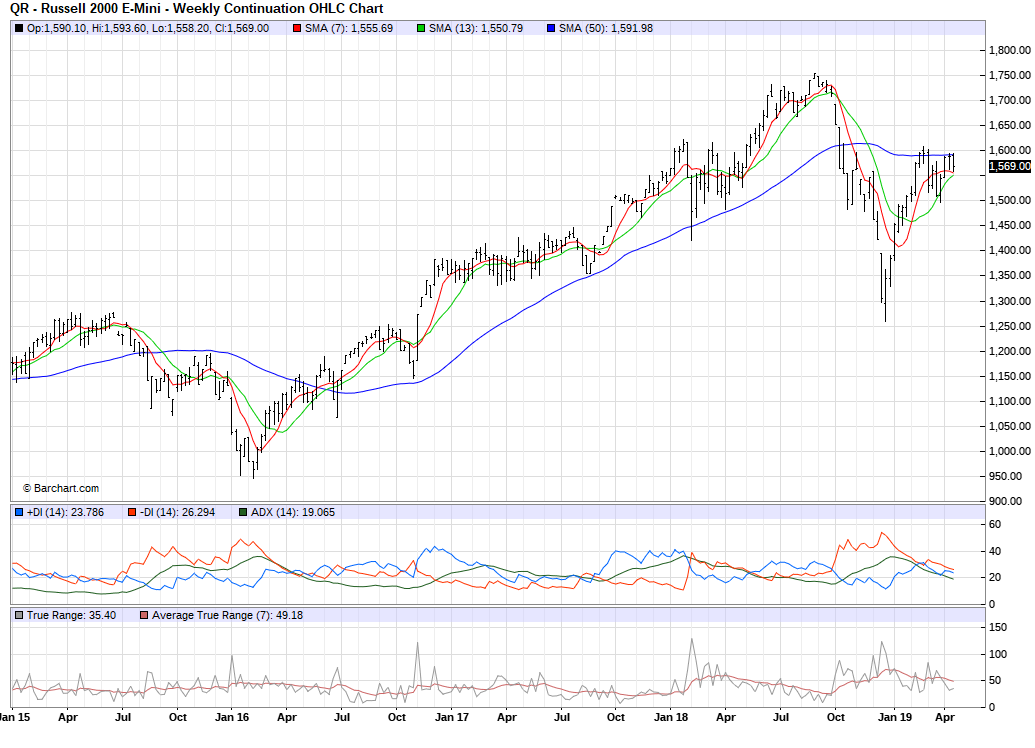


The takeaway? We’ve had a fantastic run-up from the prices and environment of Q4 2018 decline - the rest of the year could be hinted at before summer ends and Q3 2019.