


Review Of A Bruising Rebound
August 2019 weekly update, A Mid-Q3 2019 View
This weekly update will have additional top down views in addition to the vital weekly updates of the Trend trading ideas universe. (The notes as usual make this a long post.)
The recent sharp drop and then bounce in the market has opened the door to more volatile price action - the seemingly unstoppable market of just a few weeks ago is gone.
Yes, there are individual winners doing well, some of which we have in the ideas universe which many of you are profiting from but right now the broader price action does not scream “all clear”. Hold on to your winners but not so tightly that you ignore your stop loss and risk rules. If you have losers that hit their stops then obey and exit.
The Top Down Summary looks great in aggregate but let’s look closer to start this week’s review. The short version: The total notional gains are up from 220+ to 280+K, the notional gains for longs are up from 150+ to almost 180K, and the notional gains for “shorts” are also up from 72+ to 104K. Total number of ideas went from 650 to 660.
Here’s something to keep in mind, the notional profits of long is the same as 2 weeks ago BUT the notional gains of short has DOUBLED in that same time. (I’ll share the top down summary from 2 weeks ago as the last of 3 summary charts below.)

The prior week’s top down summary is shared below.
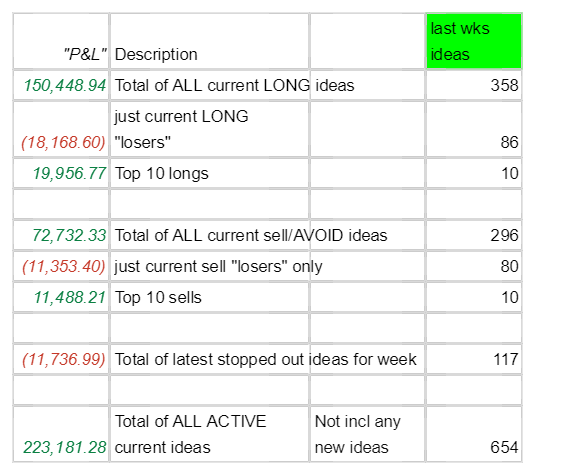
Here is the top down summary from 2 weeks ago. To repeat, we’re back to the same gains in LONGS but the gains in “shorts” has doubled.

This is all very dry to all of you I’m sure but I start here each week to give me a truly top down view of how all the trend following ideas are doing from week to week. The short version gives me a “heads up” alert that SELLS/ “shorts” could be moving up.
Which ideas didn’t survive in the past week? Shared below is a detailed chart of the STOPPED OUT IDEAS update. Most of the ideas were LONG ideas.
As we see most of them were LONG ideas, the dollar losses are roughly the same because of RISK MANAGEMENT, of risk sizing of trades.
IN other words, I don’t trade the same number of shares for $X just like $Y and $Z. Each idea has different prices and price behavior. We can measure this with a metric that most of you know about, “Average True Range”, which to oversimplify is the average of the weekly trading range for an idea’s price.
We then can review our rules and pre-plan for trade sizes and initial stop losses with this measurement.
Below we see that NYT, the ticker for the New York Times, was stopped out. I had estimated that my risk per share was 3.8 back in March 2019. That was simply my estimate that the weekly trading range for NYT was 1.9+/share.
To keep it simple for consistent reporting, I then assumed this system was willing to tolerate a multiple of 2 times that figure, or 3.8+/share as the “risk per share”. Assuming one was willing to risk losing $500 for this long trade, that would have meant 131 shares of NYT could be entered as a long trade in the week following March 1, 2019.
The point of this explanation is to show that I was not arbitrarily picking and choosing tickers to close out as a losing idea AND more importantly that you can equalize the risk for different long ideas by trading different share amounts for them. A few of the stopped out charts have been shared below.


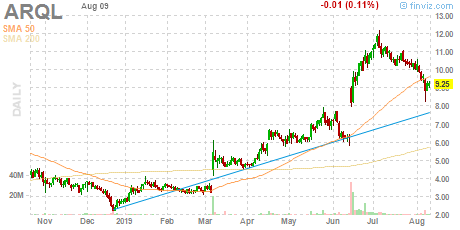
Now, is it possible that these same ideas could be back soon, and running higher? Of course, in fact, I think that Zillow, ticker $Z , might be one of those to recover but a stop loss exit is still a stop loss exit.
Let’s move on to the TOP 20 SELLS and TOP 20 LONGS. I want to start with the rough news that falling charts can keep doing that but then move on to some amazing LONG trends.
The TOP 20 SELLS summary chart has one interesting observation. Some ideas are close to NOT falling much more because they are nearly at $0 per share! In past years, one of the winning ideas was a seemingly endless fall in shares of Sunedison (to 0).

I won’t bother with charts of the SELLS. Let’s move on to the TOP 20 LONGS.


Now that’s all and well but we need NEW and FRESH ideas to look at is what on your mind. Presented below are the winners from the last 30 days. You might say that’s “too late” and I can tell you “maybe but you would be wrong to make such predictions”.
The Top 20 LONGS were mostly from March 2019 and they have kept on running up. So as a reward to long time readers and as a teaching tool for new signups, here is a list of ideas which might become leaders of the list by the time 2019 becomes 2020.
The short version of this Last 30 Days Winners list: A LOT OF precious metals.


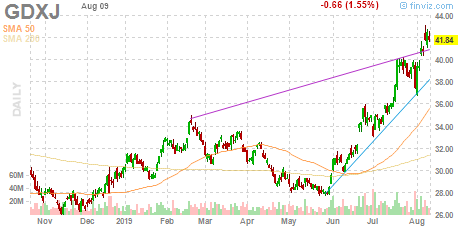


Gold has just dominated for the past month. We know the news & noise data flow. I’m not a fan of this kind of leadership but price is all we have to work with. We’re not activist, control investors with mega lines of credit or access, money center bank balance sheets to play with or in the know players with access to flows to make us look smart. We are outside, passive minority investors and traders however who can play the long game of weekly prices and longer time frames coupled with risk management.
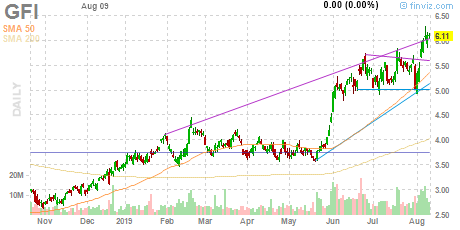
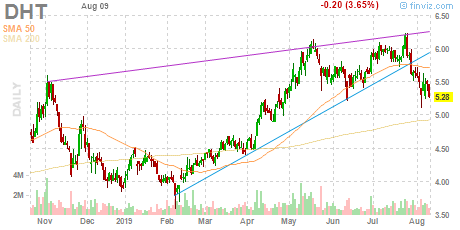
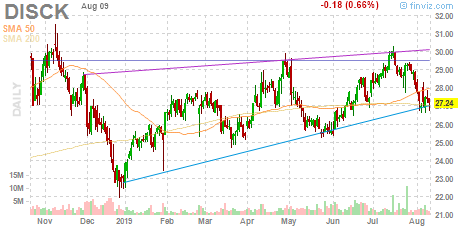
We’ve seen what works. Let’s look at what has NOT worked out so far, a LAGGARDS LIST of under-performing LONG ideas which are losing and could be stopped out.
Amazon, AMZN, which was just added back to the LONGS is already near its stop!
Monster, MNST, which has been a 30+ year juggernaut, is briefly under pressure. Really when you look at years and decades, then Amazon and Monster and many mega winners of decade-long eras will have these moments of near-term price weakness.

Just a few of these LAGGARD LIST charts.


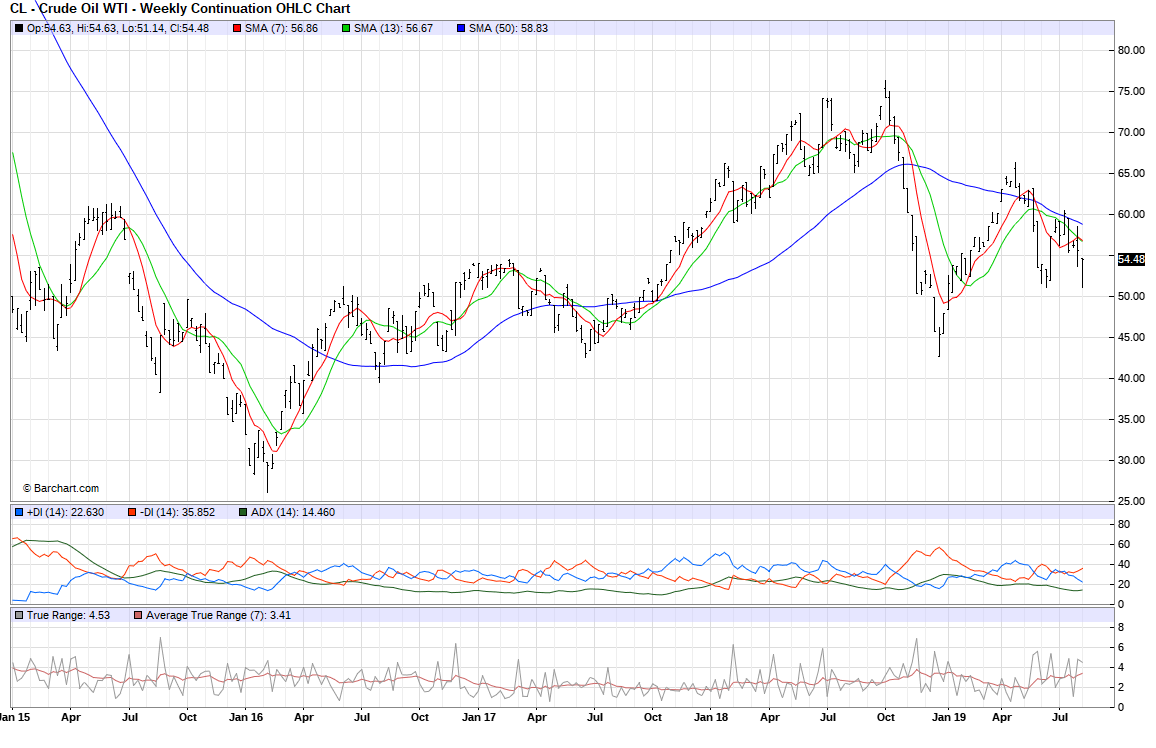
A few macro style futures charts which have been bothering me for months.


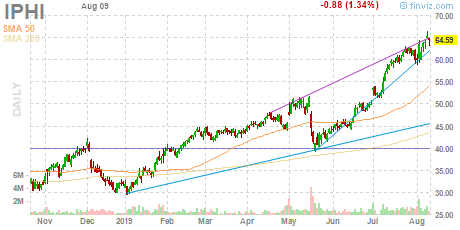
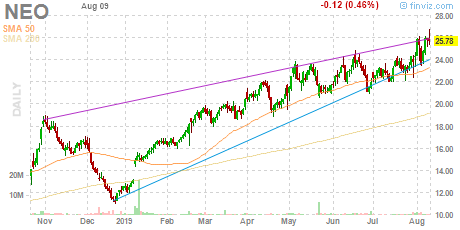
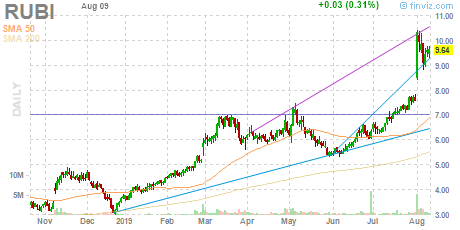
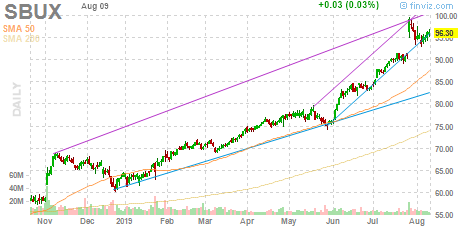
SCARY BUT 3 charts from the TOP 20 LONGS as a reminder it’s not all gloomy.
Shopify, Match and Shake Shack. We still gotta shop, “meet people” ;) and eat.
Shopify +79% (3/1/19), Match +54% (3/1/19) and Shake Shack +47% (5/3/19).


That said, there are still stop loss exit prices for these 3 bright spots in the gloom.