


Q2 2019 Update & Review Underway
Q2 2019 Trend Trading Note Update

We are now fully in Q2 2019. The atmosphere from Q4 2018 is fading for the moment, and ebullience returns. One door closes and another opens - right into a year filled with the public offerings of a decade’s worth of private aging startups which must deliver liquidity and face the bright lights of public scrutiny. For now we will just focus on conventional trend following updates. For those more focused on IPOs, commentary on this year’s market IPO fireworks will mostly likely be covered in sibling site, “The Big Stack” (TheBigStack.substack.com) over the coming months.
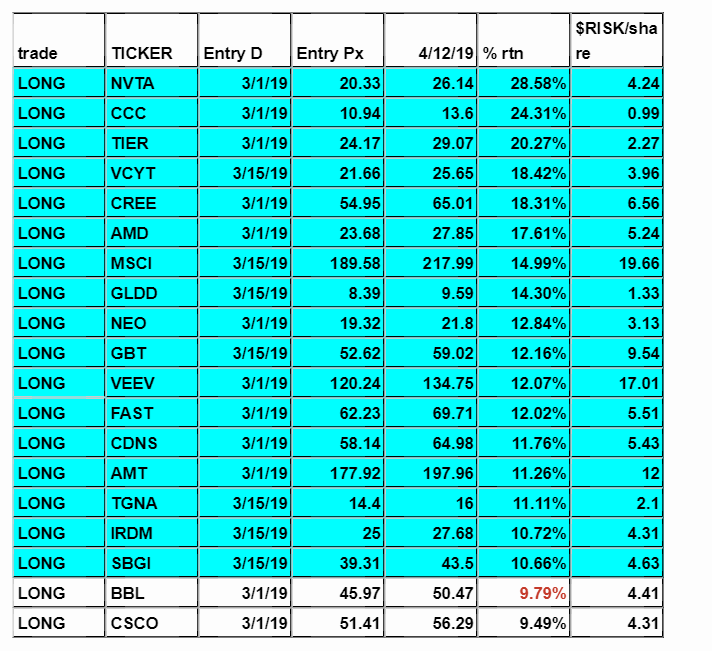
On to the charts and updates. Presented first is this week’s Top 20 LONG ideas update and summary. Tickers, the date they were added to the master ideas list, the simple notional return as of the most recent weekly closing price and a proposed risk per share from the initial entry week.
(For newer readers or those exploring trading, here are some very oversimplified explanations. Everyone else can skip this paragraph, sorry experienced traders/veteran readers, we were all new to this stuff at some time, I’m sure you understand and won’t mind this paranthetical. “$risk/share” means I have estimated a risk of loss per idea before one would exit from an idea. Say we have ticker “XYZ”, a entry price (or a weekly closing price for the first week an idea is signaled as a “long” or “short”) of $100/share, and a “$RISK/share” of $10. From these details we can estimate an initial stop loss of $90 per share ($100 share price - $10/risk). One more layer you should focus on more than this is how much YOU risk on a trade. Imagine you have a 100,000 account and you’re willing to risk losing $500 on an idea. $500/ $10/risk for “XYZ” means 50 shares for a trade. You preplan for a stop loss price of $90/share. You dont know if your trade will work out but at a minimum you know you will focus on risking no more than that amount - there will be slippage but the idea is you focus on this part first. The profits take care of themselves. NOTE: this is for active trading. Investors don’t do any of this. If I were some lucky soul who just bought great assets with great income and cash flow led by hard working geniuses who owned shares in the companies they led, then none of this would matter.)
Let’s go to a few charts from this week’s summary.


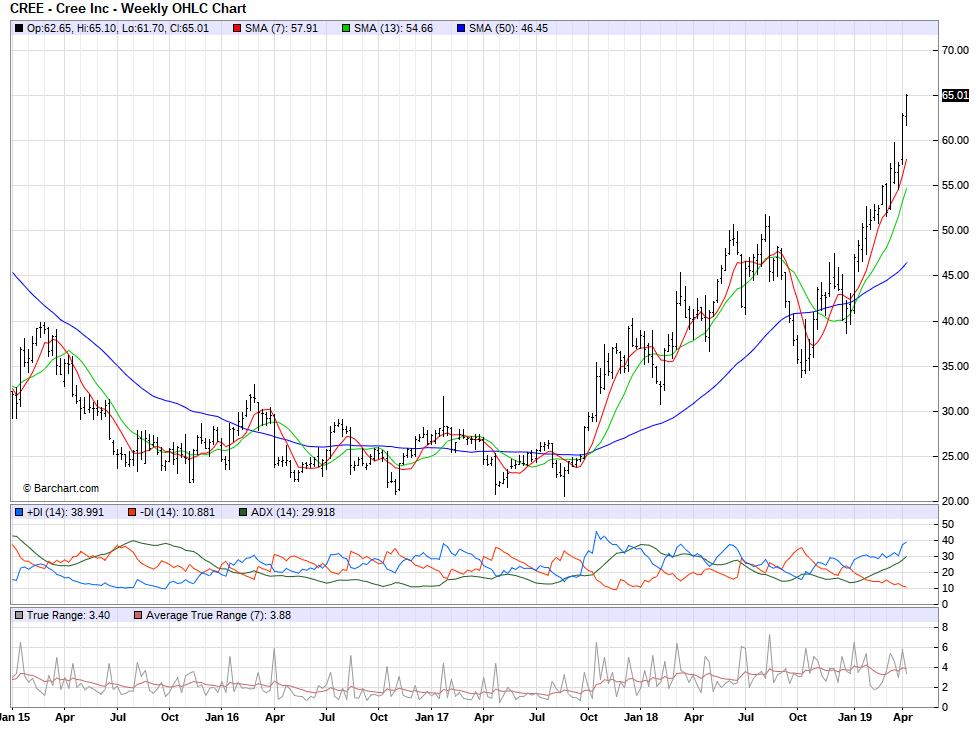

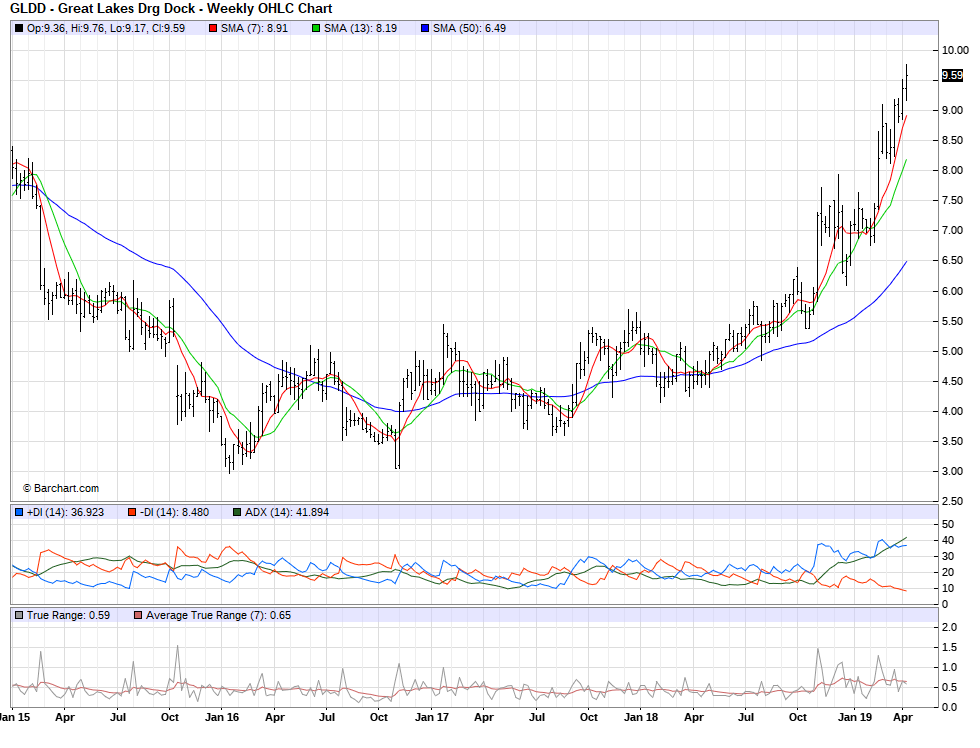


Trading becomes almost sedate and steady when we take a step back, which makes even weekly price bars look too impatient and fast. Most of you don’t have the time for the fast and frustrating action of moment by moment trading. But you do have the time to profit from using patience and practicality in paying attention to price. This list is growing with each passing week, so you will have plenty of ideas to work with. The master ideas list will be posted near the end of this week’s update.
Not all is golden, “moonlight and canoes” (Rodney Dangerfield from a film whose title is appropriate for us, “Easy Money”) - for all the sunshine we must have moonlight.
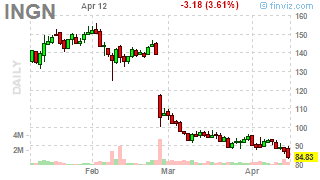
These are the Top 20 declining ideas from the master ideas universe: “top sells”

These “sell” charts portray broken expectations, unresolved challenges and change. Some will end their decline, bottom out and turn from “pariah” to “paragon”. Others will remain in the sublevel basement, fodder for tax losses and character building.


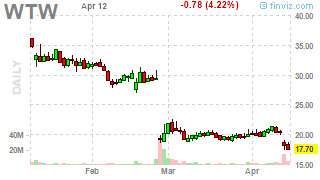

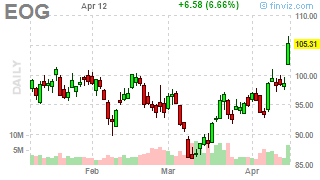
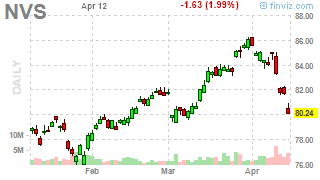
And now for the final category of quick updates. The Stopped Out ideas. As we see, there are charts for ideas which “failed” as either longs or sells. To be more precise, these ideas closing weekly prices hit or passed their most recent suggested stop loss price, as calculated from the “risk/share” estimated.
As of this update NVS is the only long idea which was stopped out. APC, EOG and PLCE were “sell” ideas which have bounced or moved up enough to hit their stops.


Here are two very long lists, presented in alphabetical order, of “everything” so far.
First a “top down” summary chart of profits and losses.

The latest master ideas list update follows below for long ideas.

It’s a long list but would you believe very soon I’ll stop this part of the update. Last year it reached 1000+ ideas and it’s a fair bit of work to assemble and report even a simple update. And soon enough, by the time Q3 2019 rolls around, we’ll have a simplified, streamlined approach along with deeper premium quality content as well.
Here is the fortunately shorter “sell”/avoid/short list of ideas as of this week. These are are potentially useful updates for “shoppers”, those looking for bottoms, and those concerned about getting caught in a sustained downtrend. Cash and the ability to silence egos outperforms the declining asset in this list.

Despite all the worries and fears, the market continues to provide even the simplest of trading methodologies a few potential ideas to work with. The “real work” begins internally with each trader, all I have done is provide some simple raw material to consider for the “easier” part.