Q2 2019 Open Update
Updates as Q2 2019 begins

Q4 2019 opens up with the return of many ideas thought buried in the ashes of Q4 2018. Mr. Market is one fickle colleague to contend with regardless of your approach.
The Top 10 Charts are shown below with summary notes and charts, with longs first and then “shorts”. (Note: “stop” in each of the below shared summary tables refers to a suggested initial stop price. Instead of focusing on “profit targets”, stop loss exit prices are the ones we hope we can avoid until we’re profitable: stop loss prices. If a trade works out and becomes more profitable, over time these stop prices are updated to follow behind the most recent weekly closing price. In fact, the market is already moving so fast enough for me to begin working on updated stop loss prices for the Top 10 leaderboard. I’ll share updates on stop prices next week.)


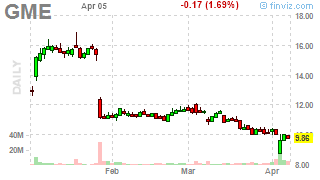
The next summary chart is a Top 10 “Shorts” (or stocks to avoid being long or sell outright). We see the death of the mass market suit at least for Tailored Brands, the “short China” trade and the continuing decline of GME as eSports rises.
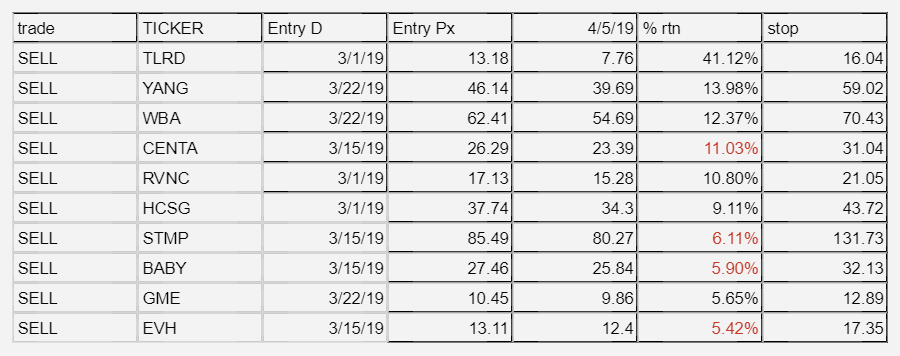


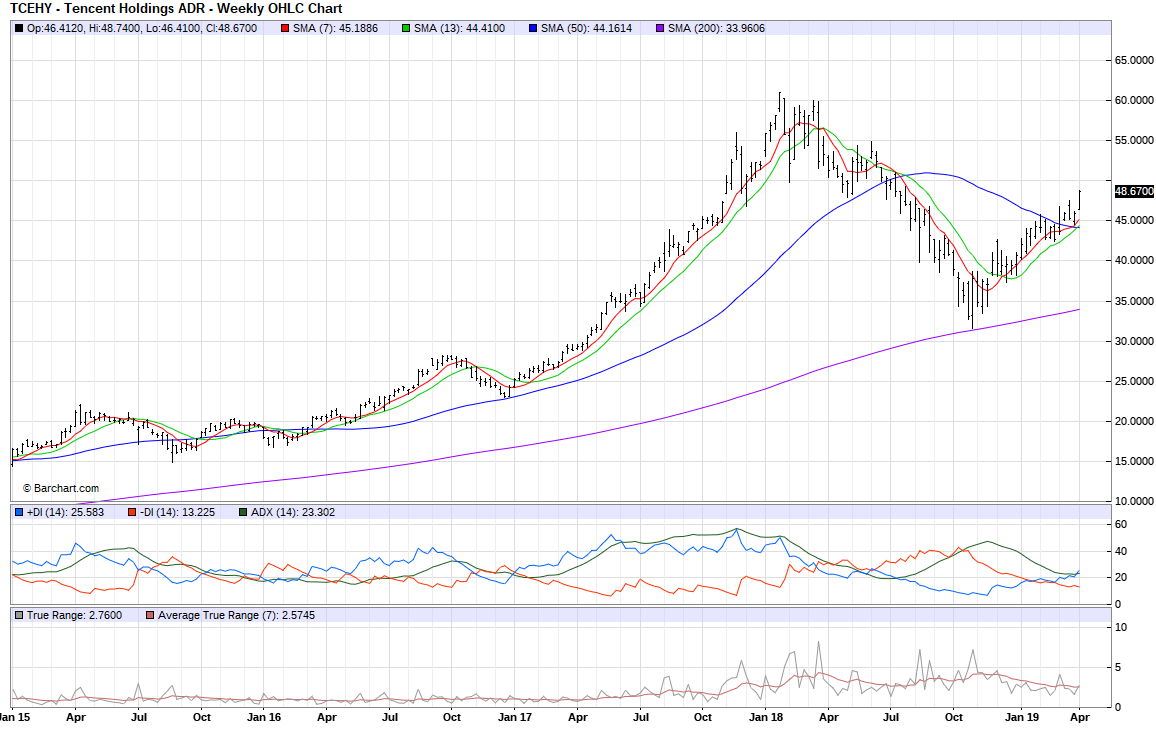
$YANG is an “inverse ETF” for China. Already obvious to active traders, this is a nice “tell” about what’s been going on for long focused Chinese stocks. I have posted this chart quite a bit over the last few weeks, Tencent Holdings (TCEHY or HK0700). This is at the moment the largest component in a variety of ETFs, beginning with the simplest emerging markets proxy for the market, ticker EEM.

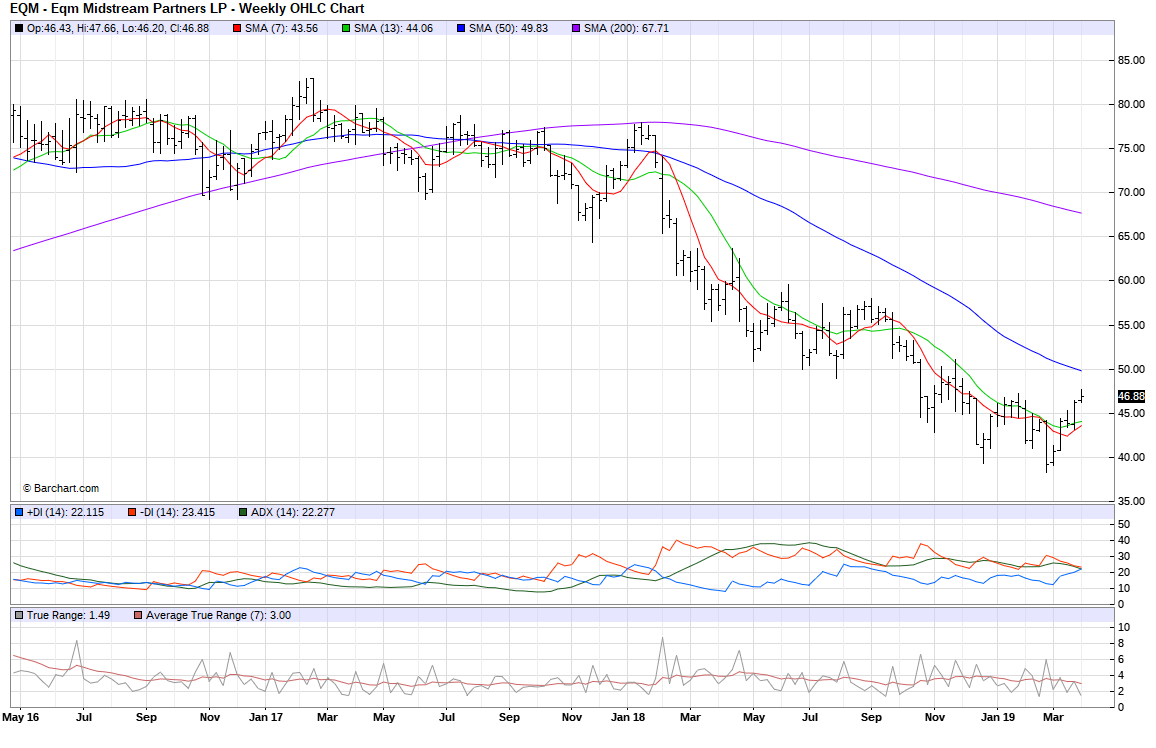
The one STOPPED OUT chart is a sell chart for EQM, barely a month into being posted as a sell, it’s already out, and we can sort of see why from the below chart.
Let’s take a look at more charts. Next up are the next 20 LONGS and SELLS.
The “Next 20" LONG Summary first.

You want a laugh? My “favorite” in this Next 20 update is PLNT, what a steady staircase machine of a chart, puns intended. Oddly enough it reminds me of old charts of Domino’s Pizza DPZ. :)


Out of curiosity, I wanted to see how DPZ looks.

And now for a NEXT 20 SELL lineup, summary first and then the charts. We can see how some raw material/natural resource plays continue to move closer to Earth. In sharp contrast to the success of Planet Fitness (PLNT), we see Weight Watchers (WTW) continuing to drop week after week.


The summary of how the ideas universe is doing can be a helpful and quick temperature reading of how Mr. Market is faring with trend following.
As of this week, we have 230 longs to 84 sells, and the notional gains (the latest weekly close versus the weekly close of an idea when it is added to the master ideas list) are rising quickly. The notional change in all the sell ideas is negative and that’s no surprise.

Compare this with the top down notional P&L from the week of March 9, and you can get a sense of how much the market has moved in just 4 weekly price bars - a month. A doubling of total ideas, and an explosion in various long ideas continuing to move up.

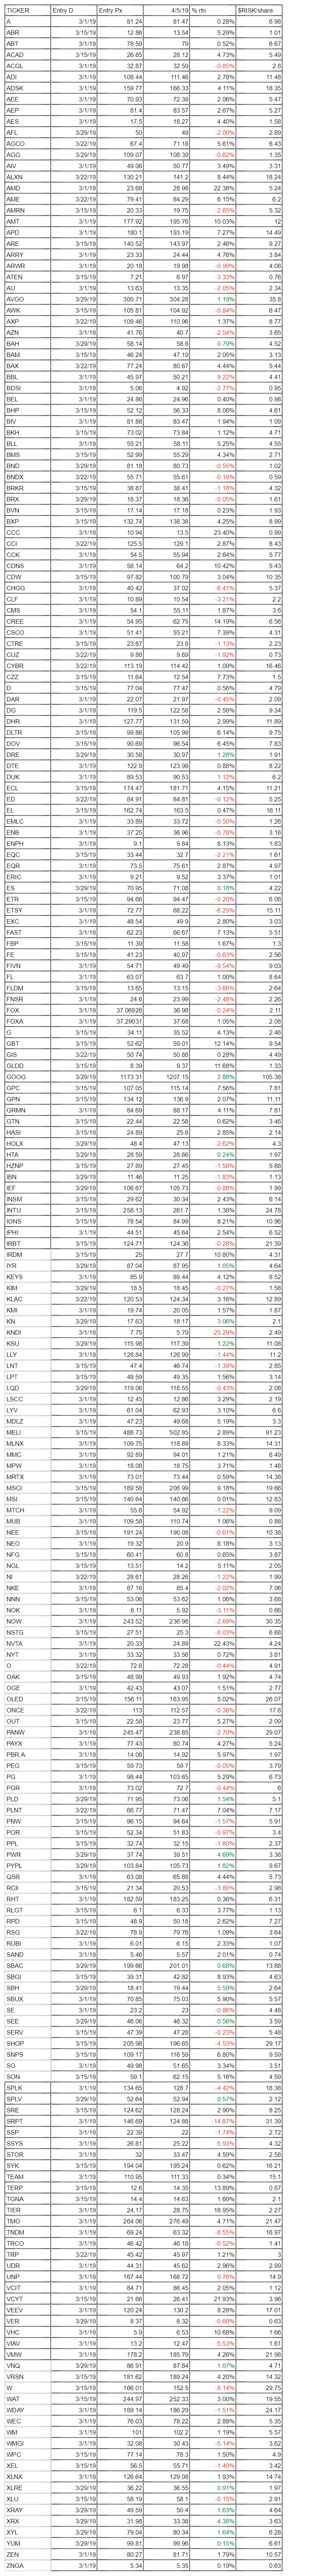
Let’s move on to the master ideas list in total, presented in alphabetical order next.
First the Master Ideas Long list. Each week it seems to grow larger - take your time.
Let’s give equal time to the SELLs. There are fewer sells than longs fortunately.

I know it’s a lot of material but do take your time. We are working with weekly prices and time frames that make day to day trading look like HFT trading. We are in the Slow Frequency Trading business - we’re impatient cousins of buy & holders in a way.
Readers from time to time write to me. Someone asked if I had a post of a system. It’s a long story but I have not done that for a number of reasons, thinking that everyone had their own approach. There are some great services available you can subscribe to, readers please feel free to let me know and I can mention them but I think Howard Lindzon’s service with Ivanhoff is maybe the most accessible. There are no secret sauces or holy grails and I keep repeating that and maybe everyone eventually agrees.
I share a large amount of content free regularly as a resource - if you need something in the way of a system, I may have to create a course or some kind of premium service or coaching in the future. But hopefully for now, you can use these charts and the summary notes of “risk per share” as a basic starting point for your notes. Another reader was kind enough to take the time to write to me and worried about missing out. Believe me, with averages like 200 Day SMAs, 50 week SMAs in active use, there is plenty of time to read and get some nugget of an idea.
Let’s begin to close out with charts of promising newer ideas. And just like that Microsoft and Google are back in the saddle. Mr. Market is fascinating and fickle.