


Price Action Still In The Dark
Q4 2019 Weekly Update

This market’s price action has not been entirely promising, its leadership and character has shifted considerably. Hot growth leadership has been tested, long awaited IPOs, some nurtured for most of the past decade, have been squeezed. The sentiment has gone from cutting edge to “cutting back” — but it still appears to be a market on pause. This is not like a year ago. Yes, there are some definite worries but when is there never something to worry about?
All we can really do here is track an ideas universe of price following of trends, and then distilling it to a few stories to make sense of what is going on.
Let’s jump into the charts — beginning with stop loss ideas. These are the ideas which hit an estimated stop loss exit price — they provide a shopping and watch list for future ideas. Today’s heroes become tomorrow’s “heels” and vice-versa. That’s why I try to start with stop loss updates and move on to the Top 20 Longs and Sells.

The long charts which were stopped out included what was a very “hot” chart, ROKU.


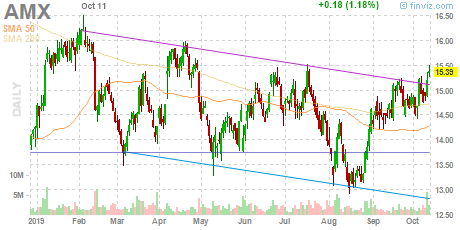
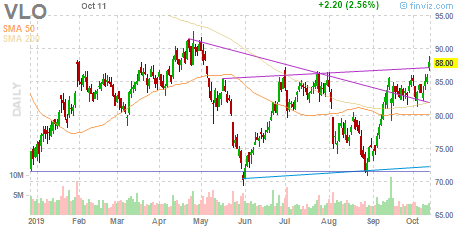
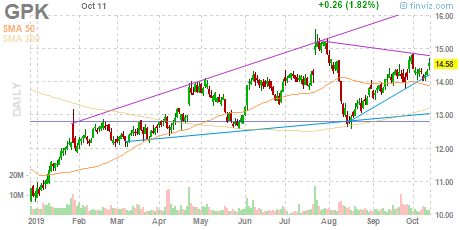
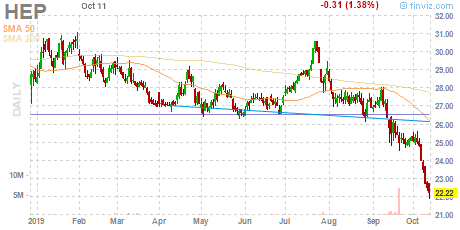
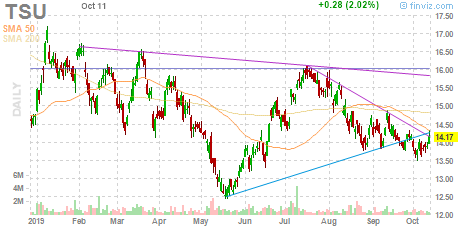
We say goodbye to these stopped out longs for now. But let’s not forget the stopped out sell charts. Here are potential longs in 2020. What’s interesting is AMX and refiners, and one shocker, RPAI (a Retail REIT). Come back to them in 3 months.


Enough of the charts stopped out. Let’s move on to the Top 20 LONGS and SELLS.
The Top 20 Longs list has changed so much from 3+ months ago — I’ve commented how even with a slow moving trend following ideas universe change can be shocking.
For your use and convenience, here is the Koyfin Charts Top 20 Longs list.

Here we are from ACGL, AMT to ZTS, from A to Z — the current long leadership.


There are the current leaders which continue to run — always be ready for change but for the moment don’t fight the tape.
And what about the Top 20 SELLS? We have a list for that one too on Koyfin. Hard to bargain hunt when something keeps on falling. There really is no rush, short of some magical catalyst or the certainty in seller exhaustion. If you want something here take your time. You have Mr. Market doing the heavy and anxious lifting of making low prices even lower. (note: $RISK/share is shared to give you sense of how much you could risk per share.)

I won’t bother with charts here for lack of space and out of compassion to longs.
Let’s move on to “laggards” - ideas which under-perform for now. Laggard SELLS first.

And of course there is a LAGGARD LONG list of under-performing long ideas.

Let’s look at charts of potential new ideas - without spreadsheet summaries.


A potentially attractive line up of new long ideas have been shared but as we know they could join the stopped out ideas list or become laggards and be in the red. Beware. But what potential new SELL ideas do we have on deck? Here’s another list of potential charts to consider for sales, shorts, reduction or simple avoidance of longs.


A lot of charts and notes have been shared with you. Be patient, take your time to go through them and see what you can use. We work with longer time frames and focus on things like risk per share and understanding that today’s winner could be a loser tomorrow and vice-versa. We’re not managing 10 digits (but if you are, please feel free to contact me, that would be fun to find out how you even found me) but what we do manage in terms of savings and investments matters a great deal. So I focus on risk and patience and not fighting the tide.
I may or may not update this with futures charts - in any event plenty of notes here.
Good luck to you and have a great weekend, week ahead and Q4 2019.