


Mr. Market Begins To Resurface
Q1 2019 Update

The market is breaking above the deep freeze of last winter’s decline. It is now time for an update. From the perspective of trend-following and price observant systems, there has been little to do until recently. The core system I observe has at last presented a meaningful list to share. The market has had a significant “V shaped” rebound in prices for many investment ideas. Prices action has now resulted in new highs, surpassing price levels last seen as Q3 2018 became the Q4 2018 selloff.
Let’s recap from the last notes:
”As has been hinted at in recent weeks, the final quarter of 2018 is about rebuilding and retrenchment - the optimist in me is prepared for better weeks to come in early 2019.
For the moment, this is a time for list building, and accumulation, profit-taking (or if necessary tax-loss harvesting).”
Time to shake the frost off. Faster systems are already in trades and doing well, and others are already taking money off the table, paring size or tightening stops, as well they should. There just is no telling. The purpose of this update is to highlight how robust the price action, so much that a basic trend trading, price following method is now filled with a variety of ideas, and not just sells and bearish inverse ETFs. There are no recommendations.
Let’s cut to the chase. Here is a preliminary list of stock tickers for long & short. Not a solid list to be cast in bronze or chiseled into marble. I’m willing to accept many of these ideas will fail to become long running winners and market leaders. The Q4 2018 decline was broad and profound enough to make any rebound back to prices that existed just as recently as last autumn to seem miraculous. But it’s a starting point.

Now that we have a modest starting point (remember it wasn’t that long ago that the idea coverage was approaching the hundreds), let’s just take a look at a few charts. I would like to post them all it would be all “forest” and you have the above shared list of potential ideas to review at your leisure.


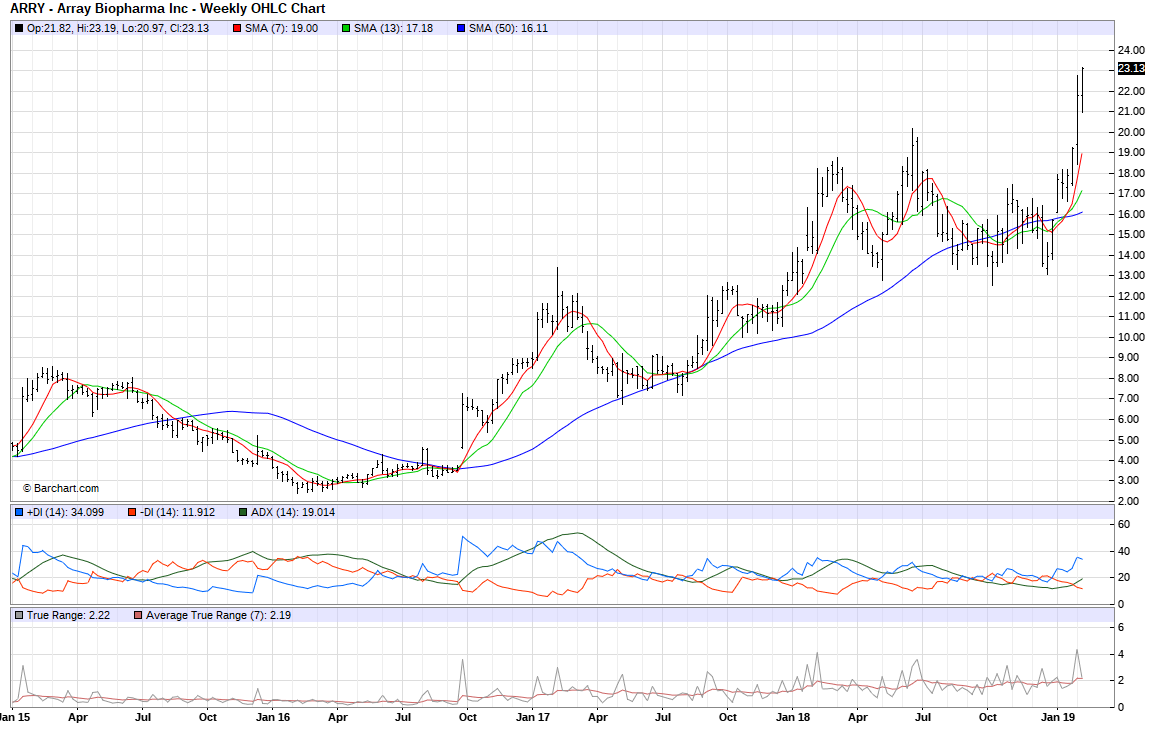


This post may be updated with more charts but you should be able to generate them easily on your setups. The broad message is this: Mr. Market has been submerged below the ice sheet for months and suddenly blew tanks to shoot up in a V-shaped bounce to resurface in the middle of Q1 2019. No telling if he ends up crash-diving or continues on a new course heading, riding out the waves of the deep ocean. You each have a responsibility to take your charts, plot a course and navigate as best as you can.