


Market Still Running Hot
July 20 Weekly Update & Notes

It is hot right now in several ways - the market is still hot and there’s a record heatwave in the Northeastern U.S. - it’s hot and a little dangerous for the unprepared.
Let’s review the top down summary, Top 20 lists, relevant charts and forward looking notes. But first a quick look at stopped out charts to find out what ideas have hit their suggested stop loss prices.
First stopped out chart is a sell in Pan American Silver (PAAS) - surprise, surprise.

It doesn’t mean an outright long idea has emerged. As we see the price of silver and relevant charts have all done this “fakeout” bounce before.
Another chart that had a similar bounce is First Horizon (FHN). Not silver but an equally dramatic price move.

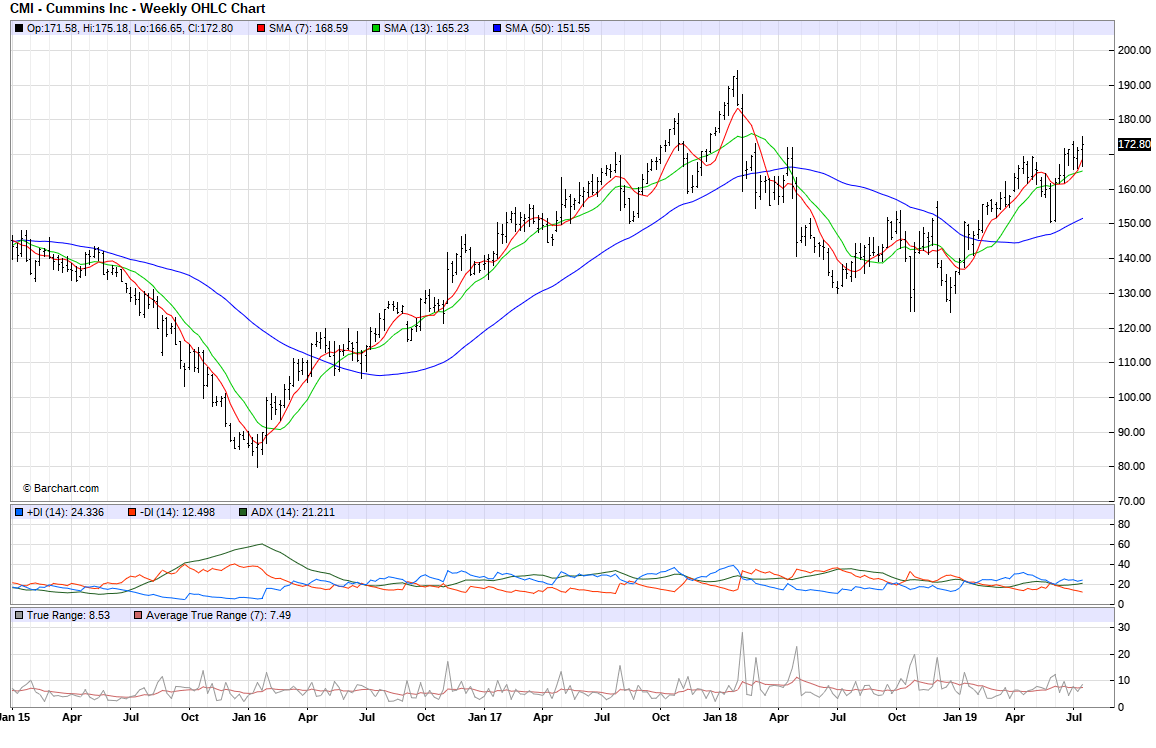
A big long, CSX, a transport major had a sharp move right down to the 50 week SMA. Again - it’s not a new trend idea in the opposite direction. As we see prices have done this before - frustrating but not atypical price action for the trend follower.

It goes to show that even with the longer time frames and averages used, price moves can come and stop out an idea. That makes the ideas which persist all the more valuable and the strongest examples come from the Top 20 LONGS and SELLS.
First the Top 20 SELLS. Here is the Koyfin Charts Top 20 SELLS updated list link.

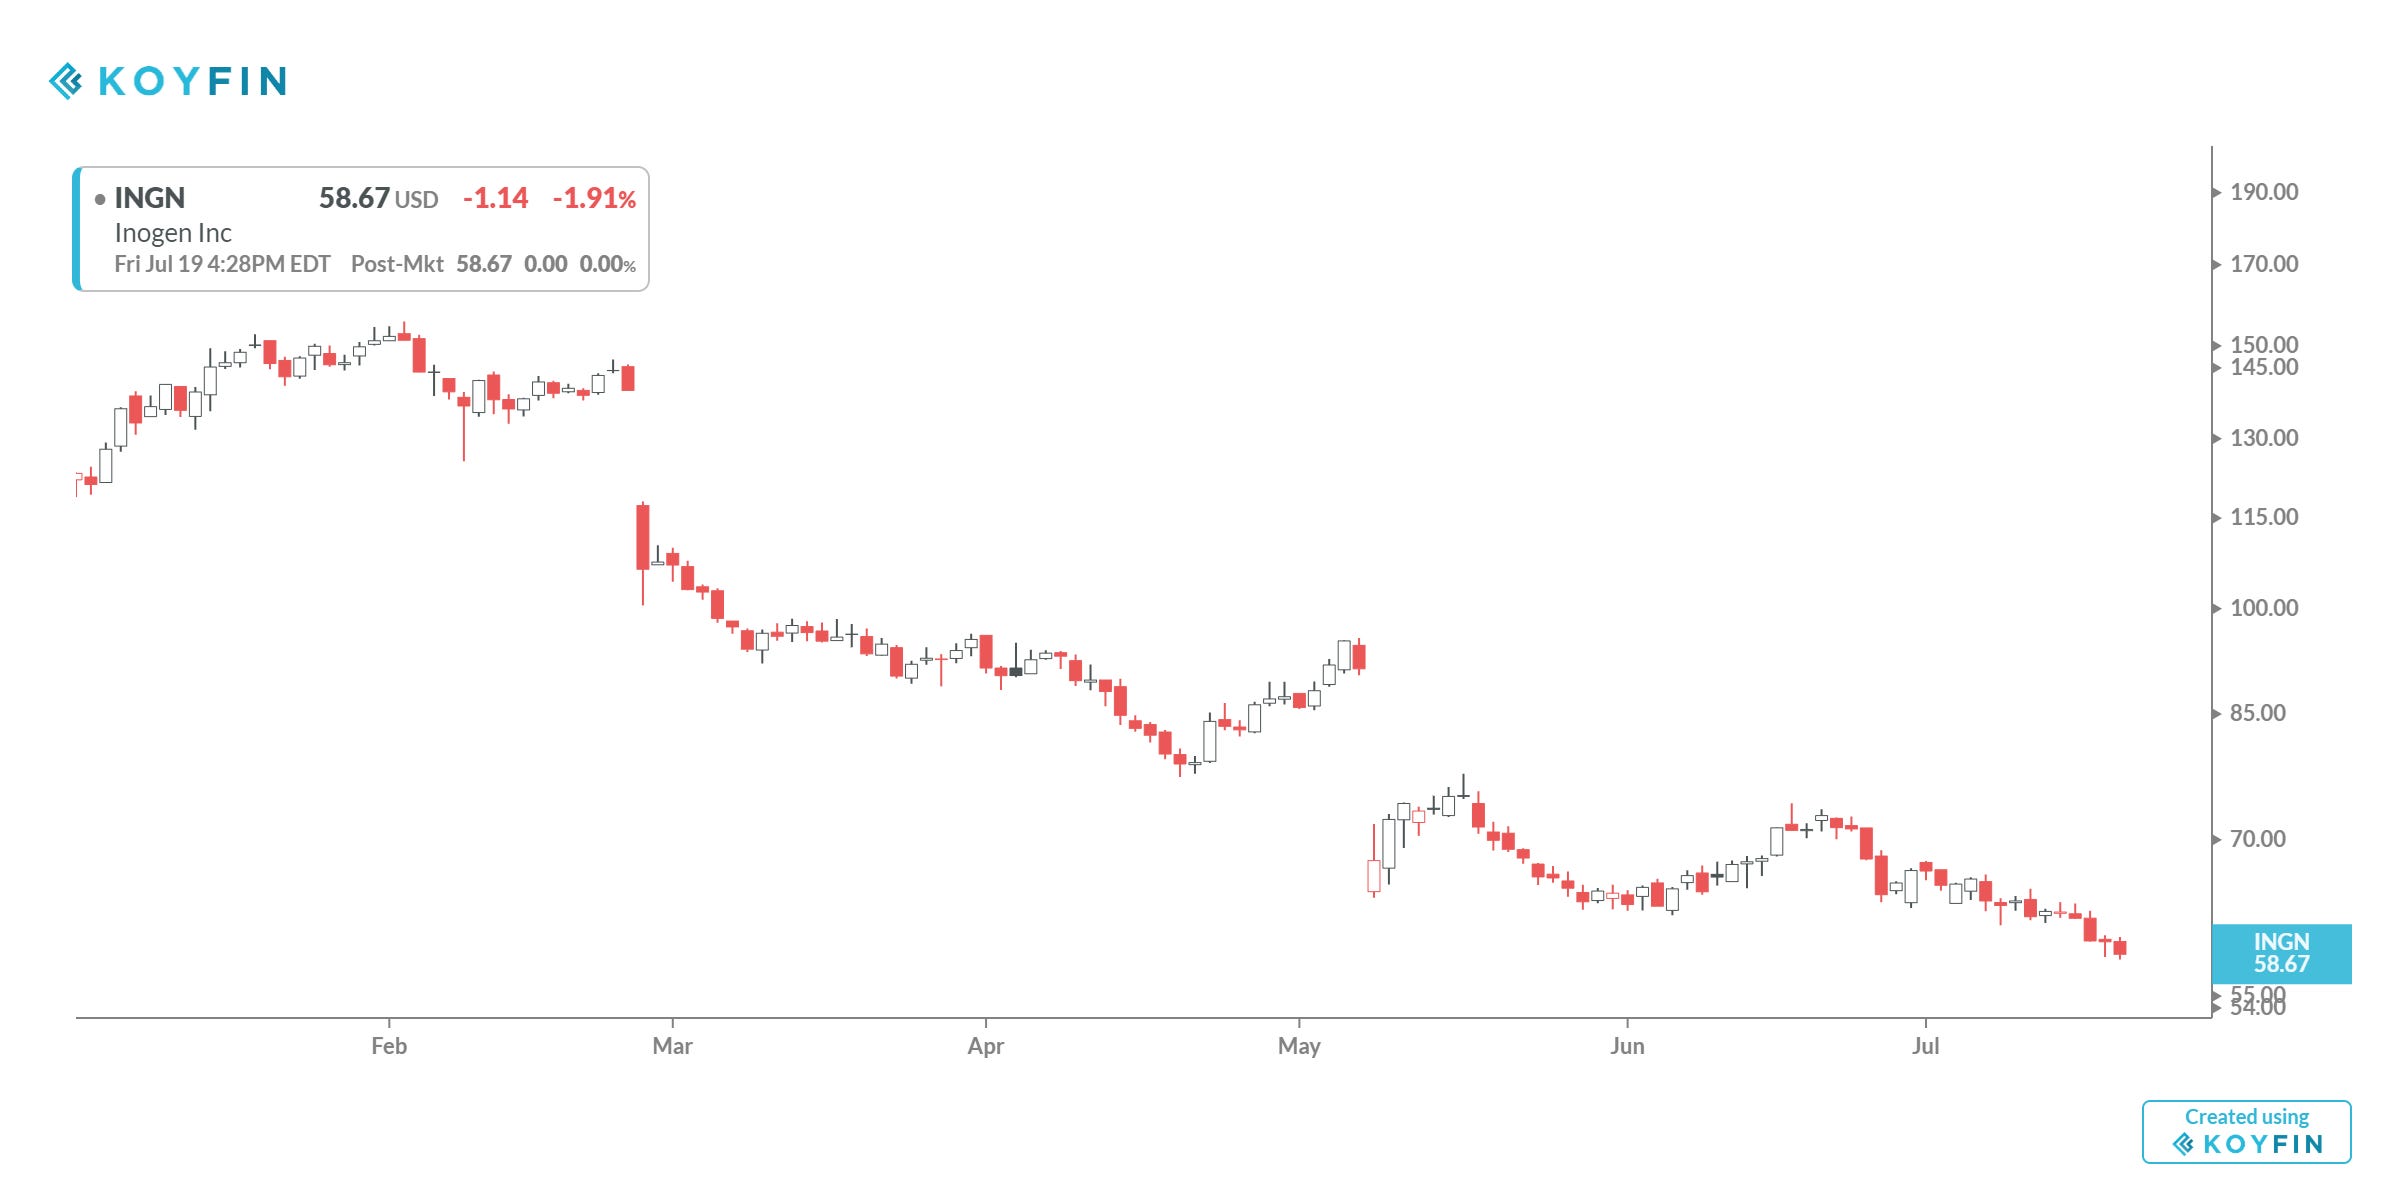
A few relevant Top 20 SELL charts include the following decliners - five charts that were the biggest decliners over the past month. Inverse Gold is a loser, no shock, and the same goes for energy related plays for those who watch energy futures prices.


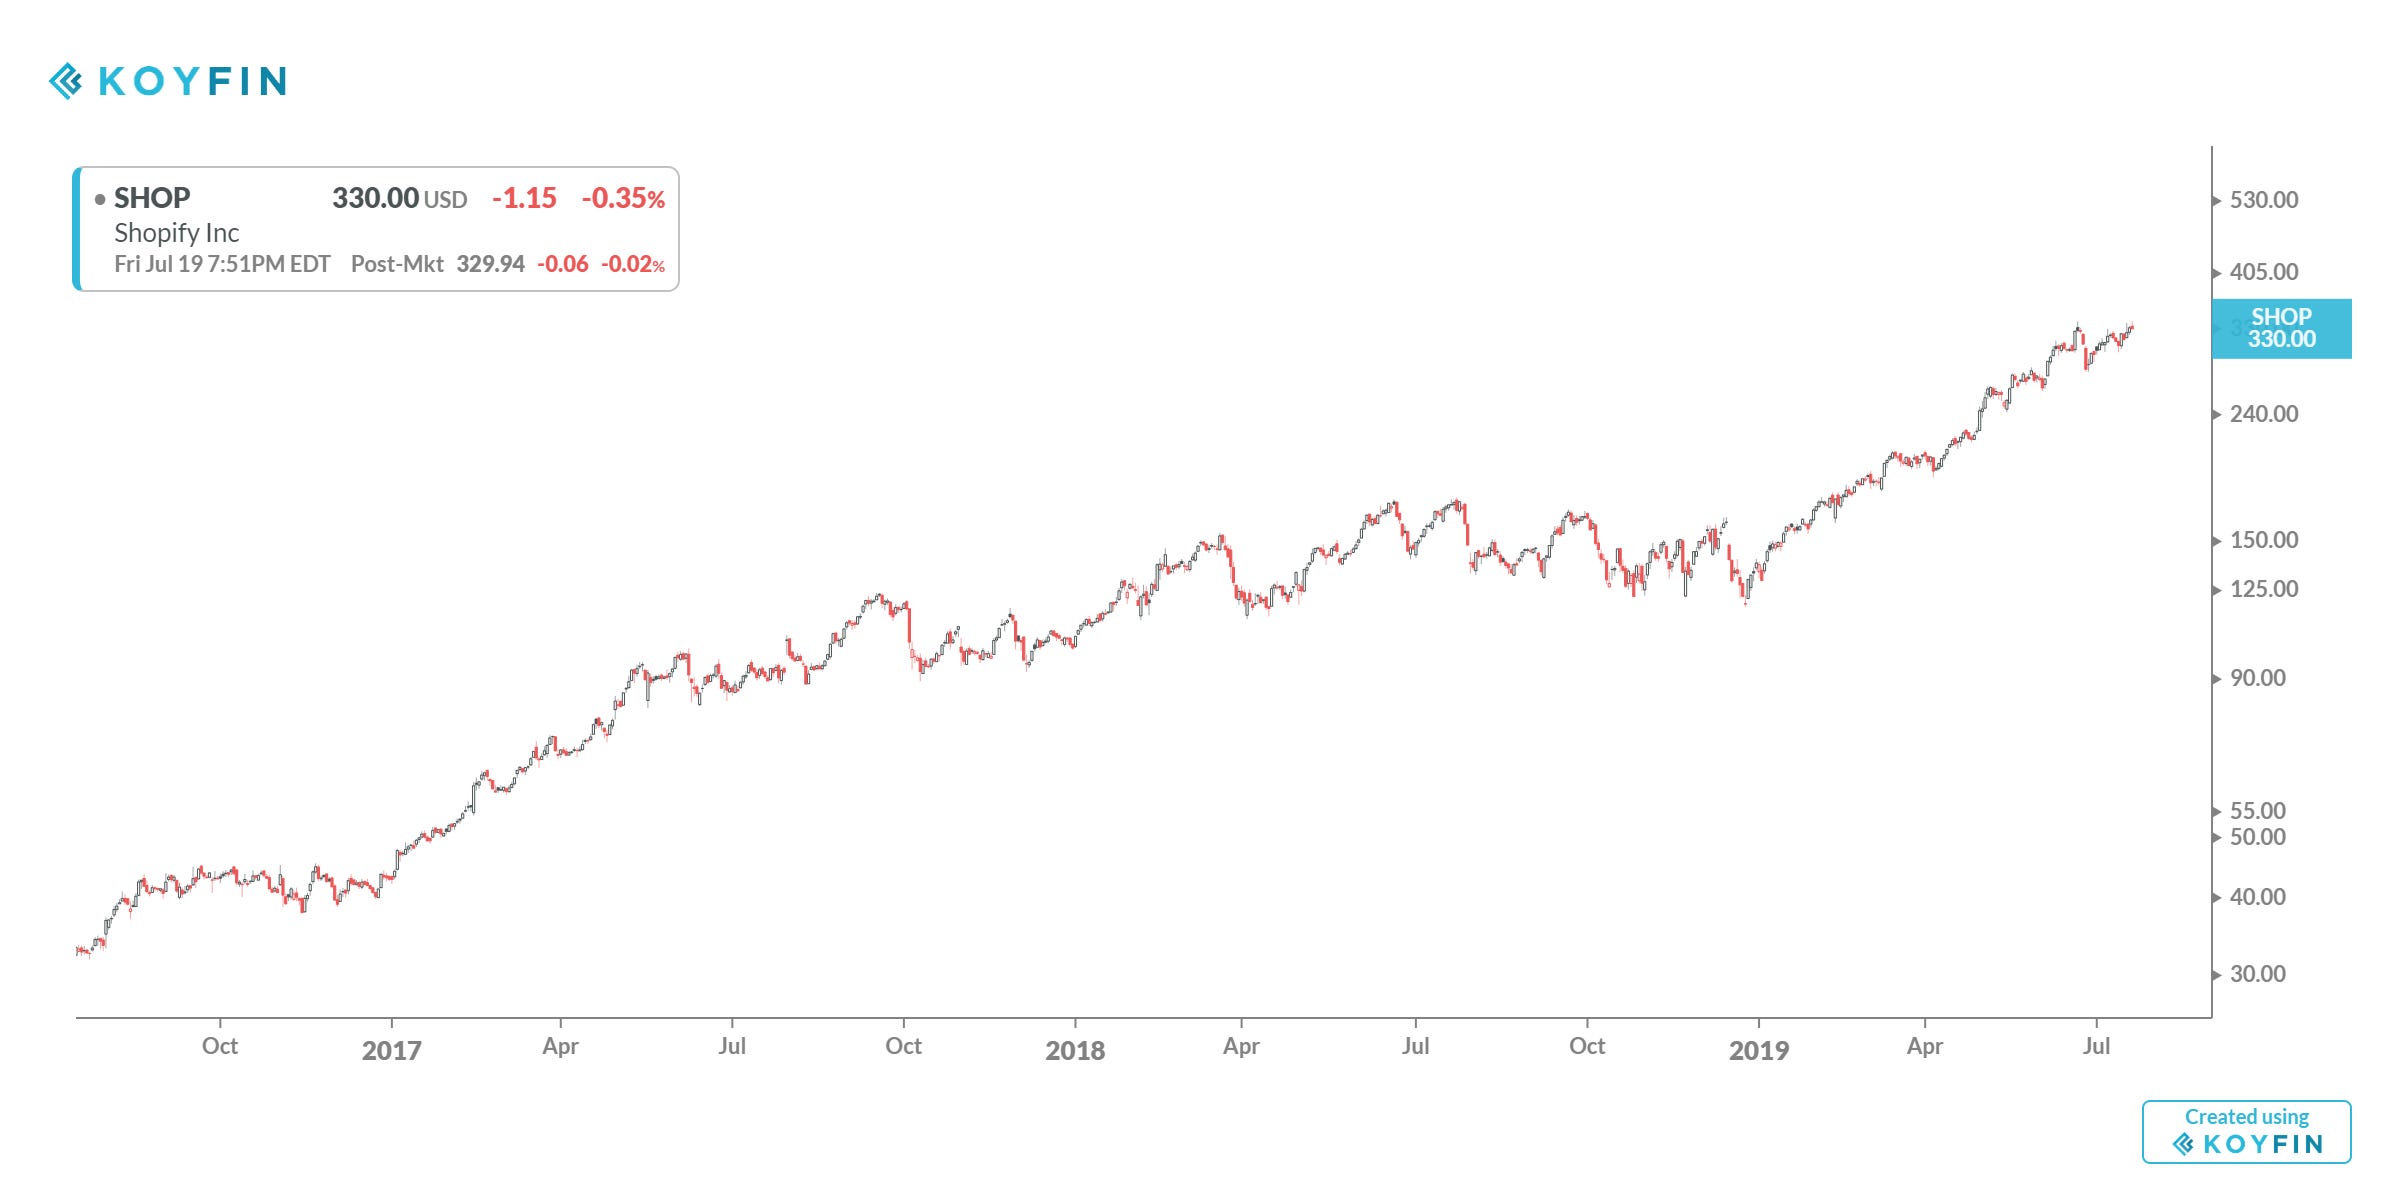
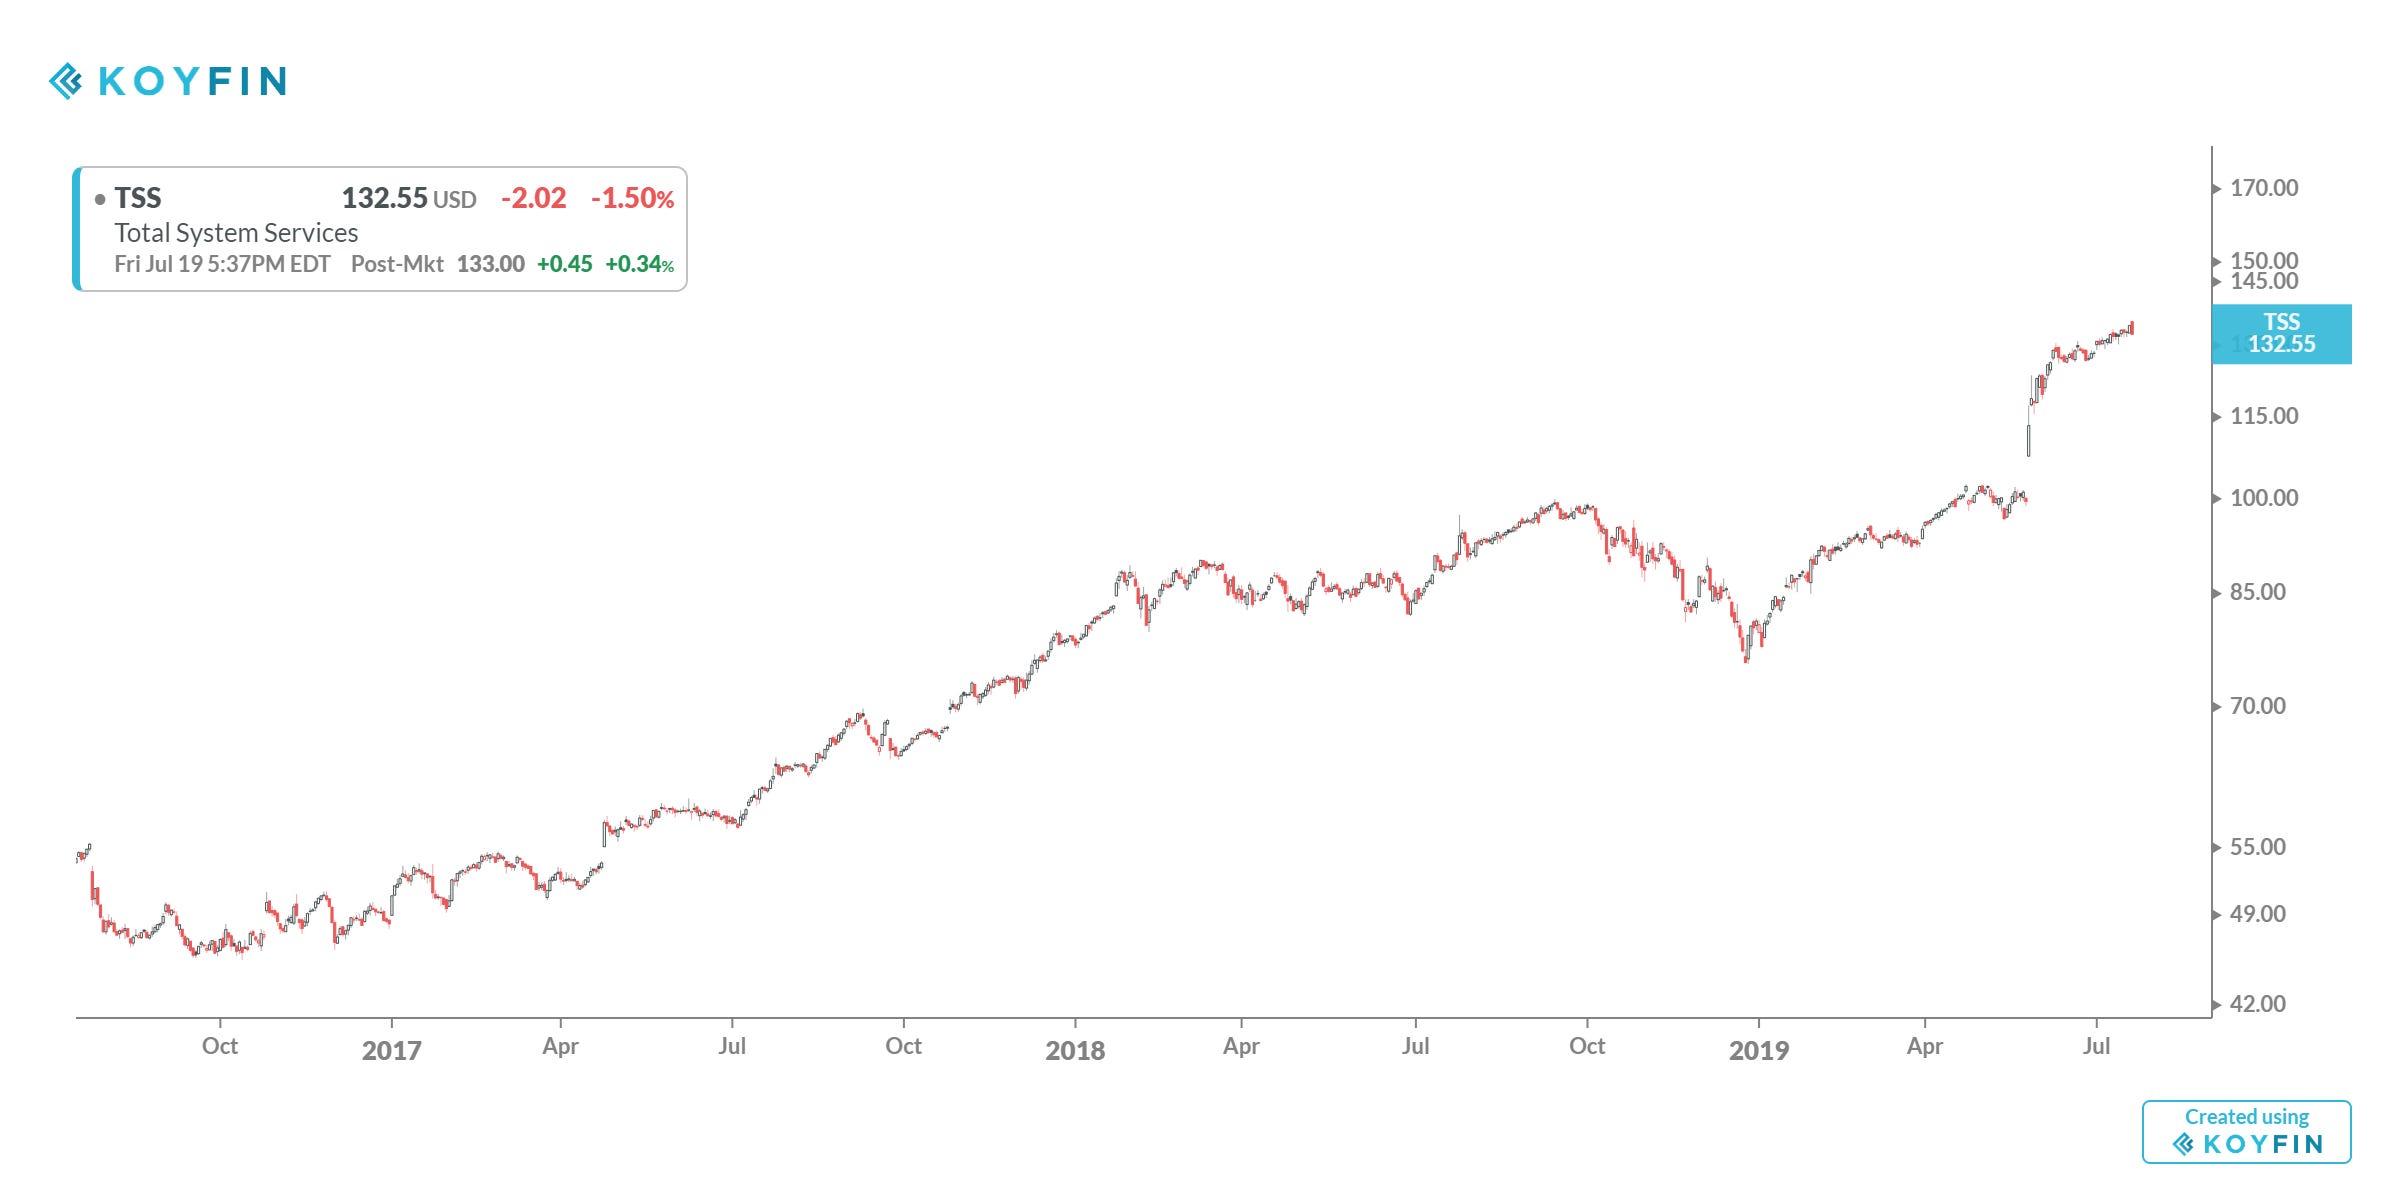
Let’s focus on the longs. The Top 20 Longs summary chart has been updated. As we see Shopify rules in the top 5 ideas from the summary chart. It came back strong after long ideas began to reemerge in March 2019. Here is the Koyfin Top 20 longs list link.
As we see many of these ideas were part of the earliest LONG ideas that were found in March 2019 and they have kept running up and the right.


These lineups are very similar from week to week and that’s not a bad thing. We want trends that we can ride week after week, and hopefully for many months if possible.
Novelty is good for personal hobbies, not for the business of investing and trading.
But I admit there will be changes, there will be new ideas and new leaders.
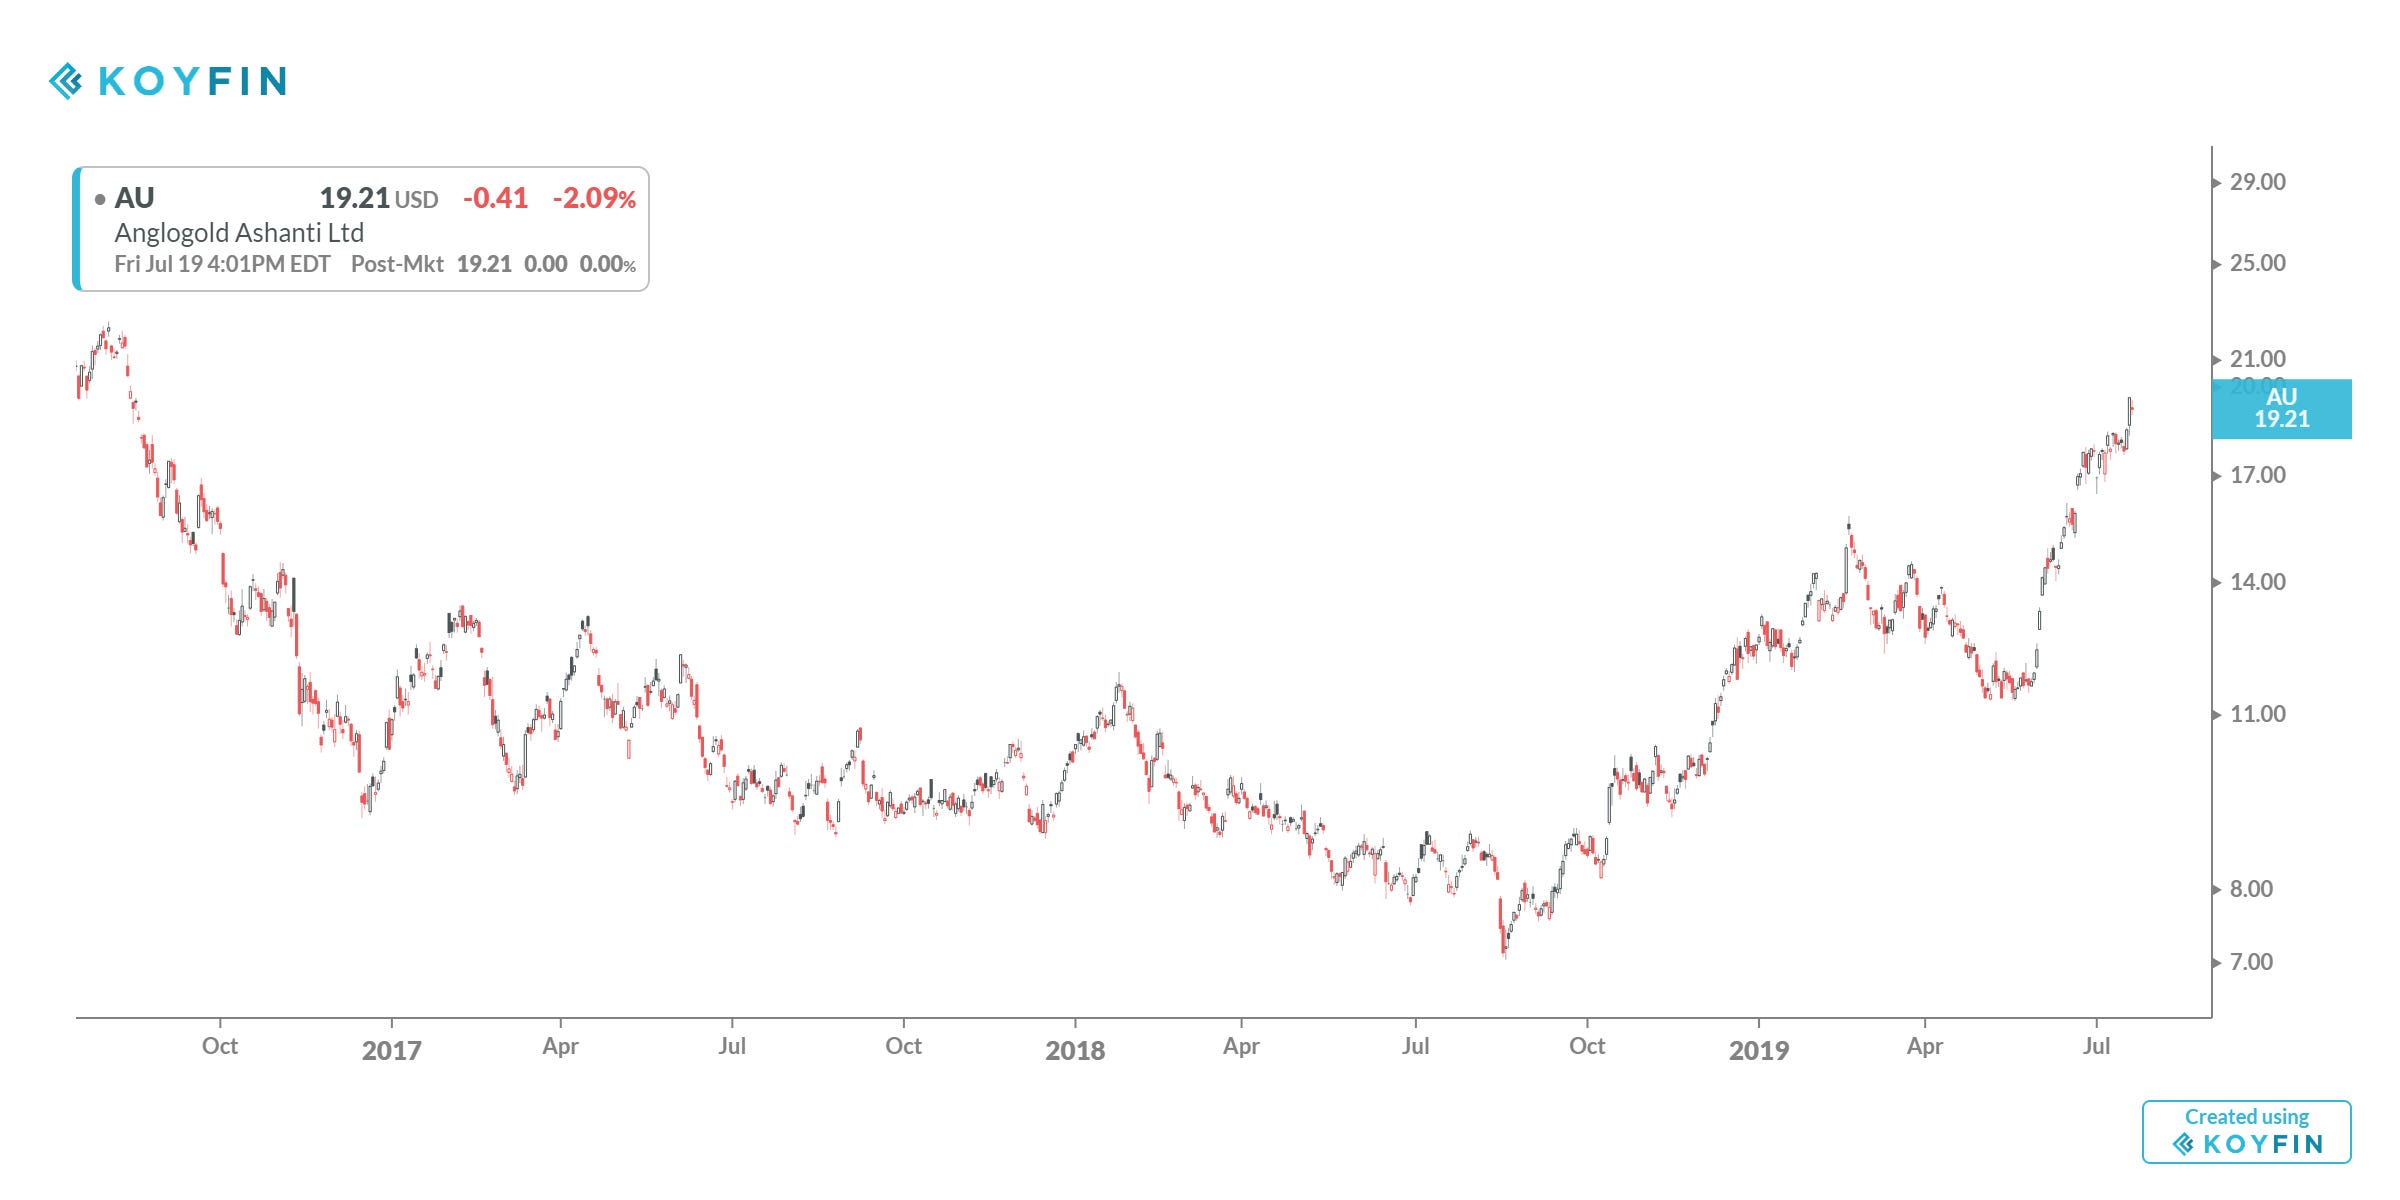
Let’s review the following charts for possible new longs that could lead as we get closer to 2020 - no promises of course. There’s just no telling but it won’t hurt to look.
(I’ll volunteer one thing, these charts are related to ideas which hit the list as of last week and many of them are basically the same trend: gold. I won’t post all of them.)


Quite a turnabout in a variety of challenged sectors/industries. But wait, there’s more. Here are more potential LONG ideas which are for the novelty seekers. They could easily implode now that they’re emerging out of the gate. We begin with AMAZON.


Big “oldish” tech, precious metals and emerging markets. Who would have thought that back when Q3 2018 collapsed into Q4 2018? This year’s leadership could be marked with a lineup by the time the holidays roll in and summer is a faded memory.
Let’s close with a top down view. Crude Oil is getting crushed in the near-term. I mentioned how this has not popped above the longer term averages and that holds.

The Russell 2000 is not joining the broader U.S. Equities Index party so far.

The AUDUSD futures chart still down the staircase month after month. I’m watching this as part of watching metals, raw materials and emerging markets.

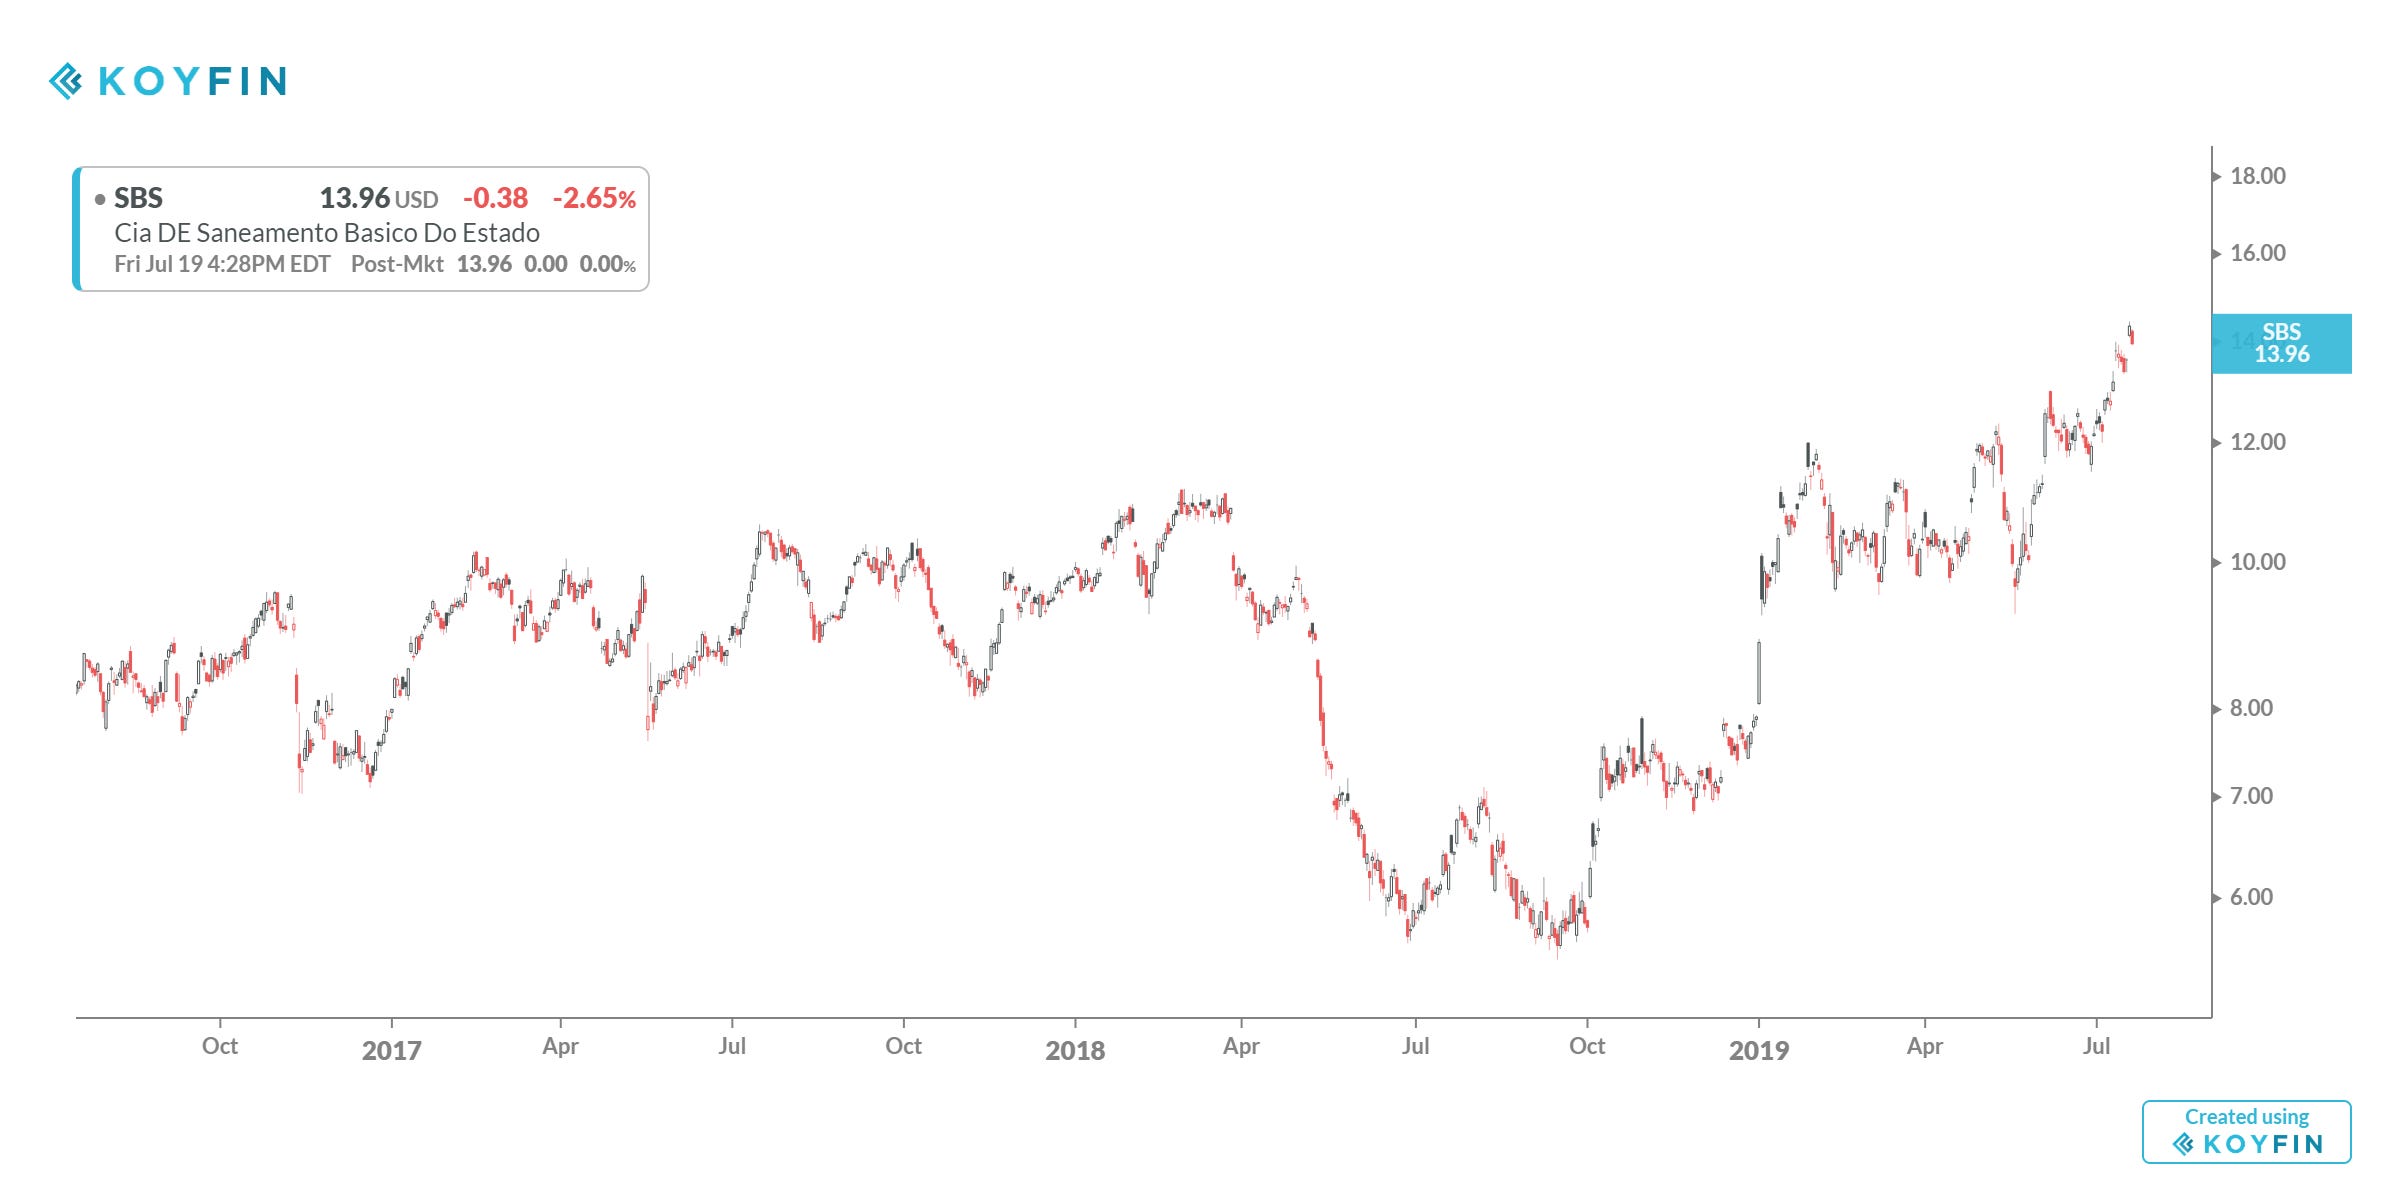
The Brazilian Real getting stronger and we saw that in various equities charts already.

Watching US Treasuries for a near-term pause or rollover but not quite there yet.


Looking further afield, a chart of European Steel Rebar futures.

Is the EURUSD bottoming out?

Eurodollar, which I have been looking at and sharing with you. Did the tightening stop or at least pause?
